 Metadata Catalogue
environment
Type of resources
Topics
Keywords
Contact for the resource
Provided by
Years
status
-

Plot data Mc Nemar: To enable comparisons with the 1961 and 2004 survey results, the Lambert Conformal Conic projection from the 2004 survey was used to precisely georeference and trim the RGB image across a 1-m2 grid, generating a total of 3,458 1-m2 grid cells. For each grid cell moss, lichen, or algae/cyanobacteria cover was extracted as one of the four cover classes: Heavy (>40%), Patchy (10–40%), Scattered (less than 10%), and None (0%) for the survey years 1962, 2004 and 2018. Ground truthing: To test the overall accuracy of cover classifications and ensure consistency with 2004 survey methodologies, a ground-truthing approach was performed. Photographs were taken of individual cells along eight transects, running west to east across the plot at 0.5, 1.5, 15.5, 16.5, 28.5, 29.5, 116.5 and 117.5 m distance from the NW corner. Each grid cell could be identified individually with an x/y coordinate in the centre and was surrounded by a rectangular frame parallel to the outer edge of the plot. A total of 174 photographs were taken and archived with Antarctica New Zealand. For each photographed grid cell, the presence of each functional group of vegetation and their cover class was assessed visually. Orthomosaic image: Aerial images were obtained using a DJI Matrice 600 Pro hex-rotor remotely piloted aircraft system equipped with a Canon EOS 5Ds camera (image size: 8688×5792 pixels, focal length: 50 mm, pixel size: 4.14 μm) on November 28, 2018. The flight altitude was 30 m above ground level, and a total of 10 ground-control points were included to provide accurate geo-referencing. An orthomosaic photo and accompanying DEM was generated with the acquired aerial images using Agisoft PhotoScan (now known as Metashape by Agisoft LLC, https://www.agisoft.com/) RELATED PUBLICATION: https://doi.org/10.1029/2022EF002823 GET DATA: https://doi.org/10.7488/ds/3417
-
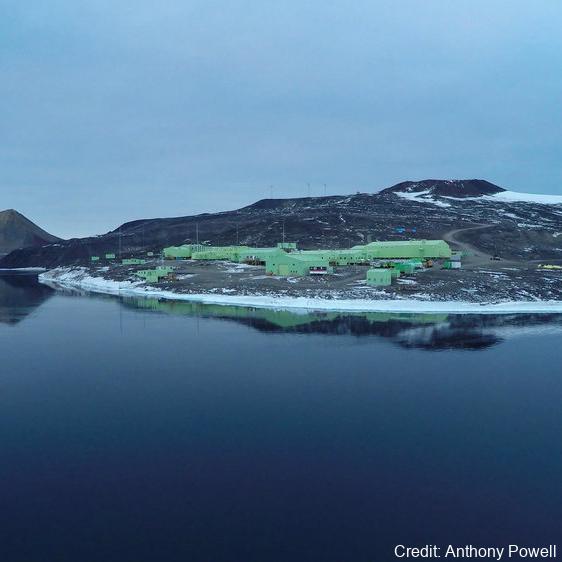
As part of the Scott Base Redevelopment Marine Monitoring Programme, the impact of Scott Base's activities on the local marine environment was assessed. Sampling took place at three sites around Hut Point Peninsula on the southern half of Ross Island during October – November 2019 to assess anthropogenic contamination. Two acoustic doppler current profilers (ADCP; Nortek Signature 500) were deployed, and set with a 2-minute sampling period in 1m vertical depth bins from the seabed to the underside of the ice. Instrument heads were kept ~0.5 m beneath the under-surface. ADCP data were downloaded, extracted from their raw formats, and averaged into 10-minute intervals. A magnetic declination of 141.09° E was applied to the measured current direction to correct the readings to reflect true north and a pressure offset was applied to standardise depths relative to ambient air pressure at the seawater surface. Information on habitats and benthic epifauna assemblage composition were collected using high resolution video across 2 25m transects at ~22m depth. Multiple overlapping passes were made across the seabed transects at ~0.5 m depth contours between ~20 – 26 m in order to create a 2D orthomosaic image of each site. Analysis of the diver-collected video was done using individual frames. The video along each transect was divided into 10 equal time segments and still frames were taken at random from the first, third, fifth, seventh and ninth segments. Eight video frames were analysed per transect (i.e., n=8 per transect and n=16 per site) by one individual to minimise observer bias. Sediment samples were collected by divers to determine contaminant concentrations and sediment characteristics (sediment particle size composition, organic matter content, organic carbon content and algal pigment content) at each site. Sponge species (Sphaerotylus antarcticus and Laternula elliptica) were collected for tissue contaminant analysis. Full description of methods is available at: https://doi.org/10.1007/s00300-023-03181-1 GET DATA: drew.lohrer@niwa.co.nz