 Metadata Catalogue
climatologyMeteorologyAtmosphere
Type of resources
Topics
Keywords
Contact for the resource
Provided by
Years
Update frequencies
status
-

Climate data have been collected at Scott Base continuously since 1957 and more recently from Arrival Heights and is one of the longest continuous climate records in Antarctica. Climate parameters measured include: wind speed and direction, air temperature, relative humidity, barometric pressure, and global, diffuse and direct solar radiation. Climate data are collected on a daily basis from both sites. At Scott Base, this takes two forms: a standard daily observation at 0900 NZDT, and continuous data collection at 10 minute and hourly intervals using a CR10X data logger. The initial record of the 0900 daily observations began on 1 March 1957 with air temperature, air pressure, wind speed and direction, and global solar radiation being measured with standard instrumentation (wind measurements since 1972). This record constitutes the reference record. In January 1997 an electronic weather station (EWS) was added to collect and archive 10 minute and hourly data. The daily manual observations continued so as to provide a continuous reference and daily record. Historically, Arrival Heights only had a wind recorder (since January 1984). A data logger was installed in January 1999 and measured air temperature, relative humidity and global solar radiation using a secondary network sensor, as well as wind speed and direction. A barometric pressure sensor was installed in 2001. A standard 10m mast was installed and all sensors were moved to the new Arrival Heights laboratory in 2007. 10-minute and hourly data are recorded. Data are retrieved and archived from both automatic stations daily, as well as manual observations from Scott Base and available on New Zealand's national climate database. From February 2019, mercury theremometers and barometers were removed from Scott Base and Arrival Heights. Where applicable, these were replaced with electronic instruments. A weighing precipitation gauge was also installed in February 2019 for the measurement of solid precipitation at Scott Base. GET DATA: https://cliflo.niwa.co.nz/
-

The data is generated through modelling simulations using the University of Victoria Earth system climate model. The modelling dataset presented here corresponds to the study entitled "Transient response of Southern Ocean ecosystems during Heinrich stadials". This dataset contains data files of the complete transient simulations (FW,FE and FWFE) and 40ka-control simulation mentioned in Table 1 and Table 2 of the manuscript. We first performed a control simulation 40ka-control integrating a total of 10000 years. We use only the last 200 years of this control simulation for our analysis. The data is generated through modelling simulations using the University of Victoria Earth system climate model. All the final data is in nc format, which can be easily read by Python/ferret or any other common data analysing software. RELATED PUBLICATION: Saini,H., Meissner,K.J., Menviel,L., & Kvale,K.(2024). Transient response of Southern Ocean ecosystems during Heinrich stadials. Paleoceanography and Paleoclimatology, 39, e2023PA004754. https://doi.org/10.1029/2023PA004754 GET DATA: https://doi.org/10.5061/dryad.k3j9kd5dt
-
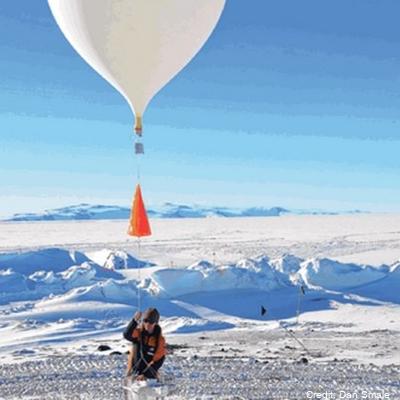
Altitude profile measurements of water vapour, ozone and aerosols using balloon packages flown through the troposphere into the stratosphere as part of the Ross Island GRUAN site activities. Maximum altitude recorded was 29 km. This project is a collaboration between the National Institute of Water and Atmospheric Research (NIWA) and NOAA. Timeline: - November 2022: 2 flights - February 2023: 1 flight - October 2023: 3 flights Data are held internally at NIWA and NOAA, and will be stored in the GRUAN database (https://www.gruan.org/data) GET_DATA: https://www.gruan.org/data
-
Ultraviolet radiation measurements over the spectral region 290-450 nm with a high precision spectro-radiometer. The spectro-radiometer was installed at Arrival Heights as a two month (November 2006 – January 2007) blind inter-comparison with the established measurement programme run by Biospherical Instruments for the USAP. The data was compared with the USAP data taken simultaneously. These data are held internally by NIWA. GET DATA: contact dan.smale@niwa.co.nz
-
Measurements of chlorine monoxide (ClO) made with a Microwave Chlorine Monoxide Millimeter Wave Spectrometer (ground-based). The instrument (ClOe1) was established in January of 1996 at Scott Base and decommissioned in October 2023. A replacement radiometer (ClOe4) was installed at Scott Base in February 2023 (an overlap in the data for timeseries continuity purposes). These data are produced in collaboration with State University of New York (SUNY) Stoney Brook and Naval Research Laboratory (NRL). “Raw” data are times and recorded microwave emission spectra. “Derived” data are column amounts and vertical profile information of chlorine monoxide (ClO). The instrument has acquired the nickname "CloeTechnique" for vertical profile information uses "optimal estimation" to extract information from pressure broadening of ClO emission line. Significant failure in early 2018 only fixed in November 2018. No data in the July - October 2018 period. Data is held at NRL and in the NDACC database. Data are available as monthly .ndm files, and additional metadata are available in the header. Instrument timeline: - ClOe1 1996-2023 - ClOe4 2023 – present GET DATA: https://www-air.larc.nasa.gov/missions/ndacc/data.html?station=scott.base#
-
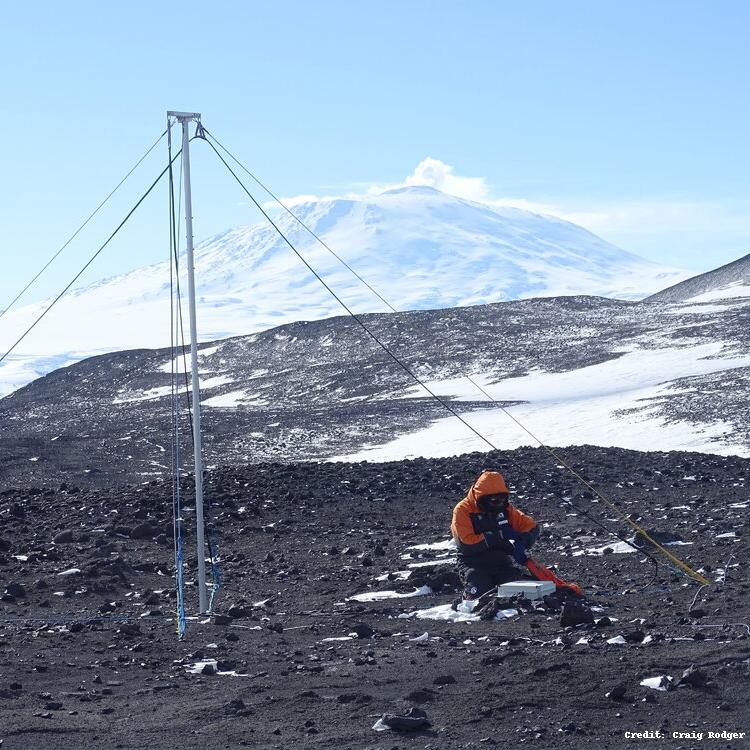
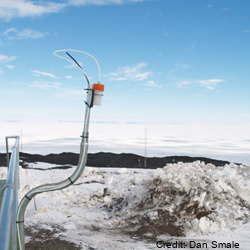
The WWLLN Very Low Frequency (VLF) Radio Sensor was installed at Scott Base in November 2015 by Dr. James Brundell and Ms. Emma Douma as part of Antarctica New Zealand Event K060-1516-A. The sensor measures the electric field in the Very Low Frequency radio range (~500 Hz-50 kHz) and passes it to a PC which processes the data for the experiments. The antenna is located behind the Hatherton lab. It was installed due to increasing manmade electromagnetic noise levels in the "quiet zone" at Arrival Heights. The observations from this antenna are now the primary WWLLN feed from Ross Island, the Arrival Height's magnetic field antenna is now a backup. WWLLN, uses the VLF feed but processes it to detect the radio-wave pulses from lightning. WWLLN observations are sent to a central processing computer to determine the time and location of lightning pulses all over the globe. The World Wide Lightning Location Network (WWLLN) is an experimental Very Low Frequency (VLF) network of sensors being developed through collaborations with research institutions across the globe. The network exploits the considerable electromagnetic power radiated by lightning as "sferics" present in the VLF band. By combining radio-pulse observations from at least 5 stations, the WWLLN central processing computers can determine the location of the original lightning discharge. As the radio-pulse observations are immediately sent back across the internet to the central processing computers locations are generated within ~10 s of the discharge, and thus near real time. There are currently about 70 active VLF receiving stations operating in the VLF World-Wide Lightning Location Network, including the Scott Base measurements. WWLLN observations are continuously transmitted to one of the WWLLN primary servers, in this case flash.ess.washington.edu at the University of Washington, Seattle, USA. GET DATA: https://space.physics.otago.ac.nz/aarddvark/
-
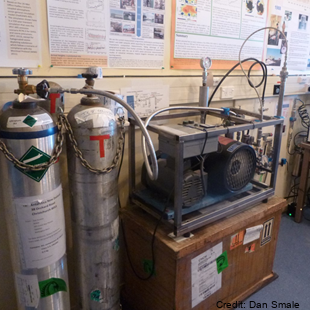
Gas samples (CO2, CH4, CO, N2O, 13CO2, 14CH4, 13CO, C18O, 14CO) are collected from an inlet atop of a mast 5 metres above ground level in North sector wind conditions. Flasks and cylinders are analysed back at NIWA Greta point Gaslab. The sampling was established in November 1989. Samples are only taken when wind is from the Northerly sector and above 5kts. High pressure cylinders: ~1600psi in 30 litre cylinders and low-pressure flask samples taken (~5 litres, 25 psi in 2 litre flask). Air samples in the Cylinders & Flasks shipped to New Zealand regularly. Analysis performed at NIWA's GASLAB located at Greta Point Wellington. Analysis by Gas chromatography (GC) and isotope ratio mass spectrometry (IRMS). A semi-automated flask sampling system was installed in February 2017, allowing extra flask samples with minimal operator intervention. GET DATA: Contact Gordon Brailsford (g.brailsford@niwa.co.nz)
-
Measurements of boundary layer concentration of ozone are made with insitu instruments that samples air continuously at Arrival Heights, Antarctica and is part of the NOAA Global Monitoring Surface Ozone Network. Original measurements at Arrival Heights were made with a Dasibi Environmental Corp in situ analyser. This was replaced with a TEI-49c in situ analyser. The TEI-49c is owned by NOAA and operated by NIWA at Arrival Heights until October 2023. In October 2023 operation of the TEI was transferred to the USAP Arrival Heights laboratory along with operational responsibility (between NOAA and USAP). This data set contains continuous UV photometric data of surface level ozone collected at 6m above ground level. Data records consist of UTC time, date, and processed ozone mixing ratio (parts per billion). Data is collected from global locations and is provided in 1 minute and 1 hour averages. Data are archived at the NOAA National Climatic Data Center (NCDC), but are produced and available from NOAA Earth System Research Laboratory (ESRL). Instrument timeline: - Dasibi 1997-2003 - TEI49c 2003 – October 2023 - TEI49i November 2023 -present at USAP Arrival Heights laboratory GET DATA: https://gml.noaa.gov/aftp/data/ozwv/SurfaceOzone/ARH/
-
Measurements of partial and total column of several atmospheric trace gases (e.g.O3, HCl, N2O, CH4, HNO3, ClONO2, HCN, HF, OCS, CO, C2H6, CFC-11, CFC-12, COF2 + others). Measurements are made with Bruker Fourier transform spectrometers, using direct sunlight (or moonlight) at infrared wavelengths (700-10000cm-1). The Bruker FTS instruments have two liquid nitrogen cooled detectors (inSb & HgCdTe) and six optical filters. For 2014-2016 seasons, operated in parallel with Bruker 120M for intercomparison studies. Bruker 120M will then be retried. Bruker 125HR will replace it. Data are routinely analysed for HNO3, HCl, CH4, N2O, CO, ClONO2, HF, C2H6, HCN, and 10+ other species measurable. Information on other trace gases is contained in the spectra, not yet analysed/retrieved. “Raw” data are times and recorded interferograms which are Fourier transformed into spectra. “Derived” data are column amounts, and in some cases limited vertical profile information, of atmospheric trace gases. Technique for vertical profile information uses "optimal estimation" to extract information from pressure broadening of absorption lines: SFIT2/SFIT4. The original solar tracker was replaced with a newer tracker in December 2017, active tracking of sun now possible. A Bruker EM27-Sun operated for a summer season at AHTS, to access capability. Measurements of total column CO2, CH4 and CO. Data archived as part of the COCCON network. Instrument timeline: - Bomen DA2 FTS 1990-1994 (HNO3 and HCl only) - Bruker 120M: 1996-2016 - Bruker 125HR: 2015 – present - EM27-Sun: Campaign based low resolution instrument (CO2, CH4 and CO only). February 2016 and then November 2020 – February 2021 GET DATA: https://www-air.larc.nasa.gov/missions/ndacc/data.html?station=arrival.heights GET DATA (EM27-Sun): https://www.imk-asf.kit.edu/english/COCCON.php
-
Measurements of total column of ozone made with Dobson spectrophotometer that measures either direct or zenith scattered ultraviolet light. The instrument was established in September of 1989 at 77° 49.8'S, 166° 39.6'E. Additionally a Brewer spectrophotometer took total column ozone measurements at Scott from 1989 to 1996. From 1989 to 2006 the Dobson (ID 17) was operated in manual mode but had an electronic encoder and computer added in 2006 for recording measurements. The data acquisition system was upgraded in Febuerary 2015 at Lauder, NZ. It is now running the JMA automation system. The Dobson (instrument ID: D17) is shipped out for maintenance and intercomparison with regional standard Dobson in Melbourne approximately every 5 years. Data (for both Dobson and Brewer) is held internally by NIWA and in the NDACC database. Data is also archived in the ozone and UV data centre Toronto, “Raw” data are times and instrument settings for instrument readings. “Derived” data are column amounts of ozone. Time line: Dobson 1987 -present Brewer 1989-1996 GET DATA: https://www-air.larc.nasa.gov/missions/ndacc/data.html?station=arrival.heights#