 Metadata Catalogue
PANGAEA
Type of resources
Topics
Keywords
Contact for the resource
Provided by
Years
Update frequencies
status
-

These data were aquired with a Terrestrial Radar Interferometer overlooking the grounding zone of Priestley Glacier, Antarctica. The time series contains differential interferograms with a 12h temporal baseline covering an approximately 8 day period in November 2018. Tidal modulation of ice streams and their adjacent ice shelves is a real-world experiment to understand ice-dynamic processes. We observe the dynamics of Priestley Glacier, Antarctica, using Terrestrial Radar Interferometry (TRI) and GNSS. Ocean tides are predominantly diurnal but horizontal GNSS displacements oscillate also semi-diurnally. The oscillations are strongest in the ice shelf and tidal signatures decay near-linearly in the TRI data over >10 km upstream of the grounding line. Tidal flexing is observed >6 km upstream of the grounding line including cm-scale uplift. Tidal grounding line migration is small and <40 % of the ice thickness. The frequency doubling of horizontal displacements relative to the ocean tides is consistent with variable ice-shelf buttressing demonstrated with a visco-elastic Maxwell model. Taken together, this supports previously hypothesized flexural ice softening in the grounding-zone through tides and offers new observational constraints for the role of ice rheology in ice-shelf buttressing. Time series of line-of-sight flowfields averaged over approximately three hours. Data were taken with a Terrestrial Radar Interferometer in November 2018 at the grounding zone of Priestley Glacier, Antarctica – The Zip Archive contains 288 Geotiff in South polar stereographic projection – Each raster has 4027 x 4746 entries – The file name details the approximately 3h time inverval of aquisition with Stack_YYYYMMDD_HHMMSS_YYYYMMDD_HHMMSS marking the beginning and end of the time interval, respectively. – The line of sight velocities are given in meters per year Related Publication: Drews, R., Wild, C. T., Marsh, O. J., Rack, W., Ehlers, T. A., Neckel, N., & Helm, V. (2021). Grounding-zone flow variability of Priestley Glacier, Antarctica, in a diurnal tidal regime. Geophysical Research Letters, 48, e2021GL093853. https://doi.org/10.1029/2021GL093853 GET DATA: https://doi.org/10.1594/PANGAEA.935702
-

This is GNSS data of four stations covering the grounding zone of Priestley Glacier Antarctica. Tidal modulation of ice streams and their adjacent ice shelves is a real-world experiment to understand ice-dynamic processes. We observe the dynamics of Priestley Glacier, Antarctica, using Terrestrial Radar Interferometry (TRI) and GNSS. Ocean tides are predominantly diurnal but horizontal GNSS displacements oscillate also semi-diurnally. The oscillations are strongest in the ice shelf and tidal signatures decay near-linearly in the TRI data over >10 km upstream of the grounding line. Tidal flexing is observed >6 km upstream of the grounding line including cm-scale uplift. Tidal grounding line migration is small and <40 % of the ice thickness. The frequency doubling of horizontal displacements relative to the ocean tides is consistent with variable ice-shelf buttressing demonstrated with a visco-elastic Maxwell model. Taken together, this supports previously hypothesized flexural ice softening in the grounding-zone through tides and offers new observational constraints for the role of ice rheology in ice-shelf buttressing. Related Publication: Drews, R., Wild, C. T., Marsh, O. J., Rack, W., Ehlers, T. A., Neckel, N., & Helm, V. (2021). Grounding-zone flow variability of Priestley Glacier, Antarctica, in a diurnal tidal regime. Geophysical Research Letters, 48, e2021GL093853. https://doi.org/10.1029/2021GL093853 GET DATA: https://doi.pangaea.de/10.1594/PANGAEA.936090
-
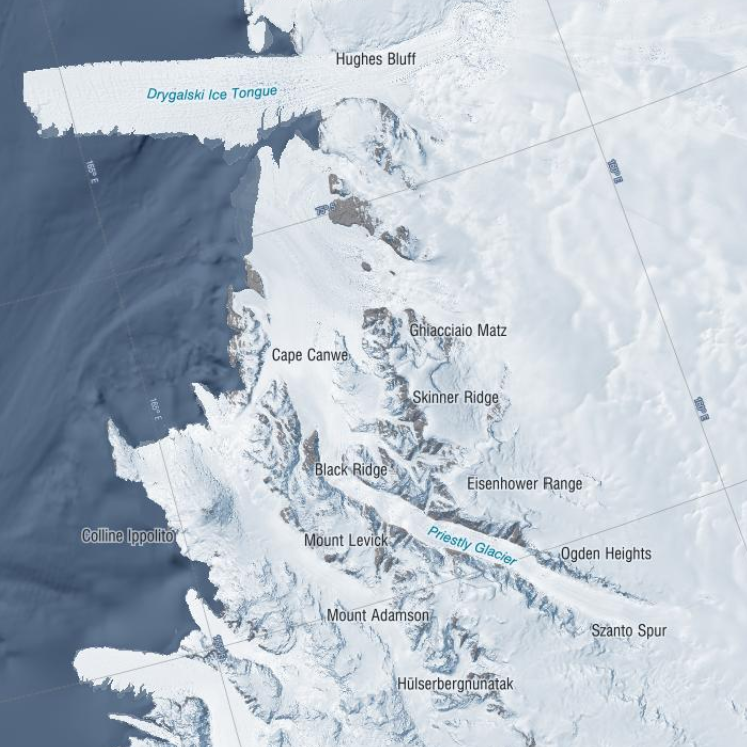
These data were aquired with a Terrestrial Radar Interferometer overlooking the grounding zone of Priestley Glacier, Antarctica. The time series contains differential interferograms with a 12h temporal baseline covering an approximately 8 day period in November 2018. Tidal modulation of ice streams and their adjacent ice shelves is a real-world experiment to understand ice-dynamic processes. We observe the dynamics of Priestley Glacier, Antarctica, using Terrestrial Radar Interferometry (TRI) and GNSS. Ocean tides are predominantly diurnal but horizontal GNSS displacements oscillate also semi-diurnally. The oscillations are strongest in the ice shelf and tidal signatures decay near-linearly in the TRI data over >10 km upstream of the grounding line. Tidal flexing is observed >6 km upstream of the grounding line including cm-scale uplift. Tidal grounding line migration is small and <40 % of the ice thickness. The frequency doubling of horizontal displacements relative to the ocean tides is consistent with variable ice-shelf buttressing demonstrated with a visco-elastic Maxwell model. Taken together, this supports previously hypothesized flexural ice softening in the grounding-zone through tides and offers new observational constraints for the role of ice rheology in ice-shelf buttressing. Related Publication: Drews, R., Wild, C. T., Marsh, O. J., Rack, W., Ehlers, T. A., Neckel, N., & Helm, V. (2021). Grounding-zone flow variability of Priestley Glacier, Antarctica, in a diurnal tidal regime. Geophysical Research Letters, 48, e2021GL093853. https://doi.org/10.1029/2021GL093853 GET DATA: https://doi.org/10.1594/PANGAEA.935707
-
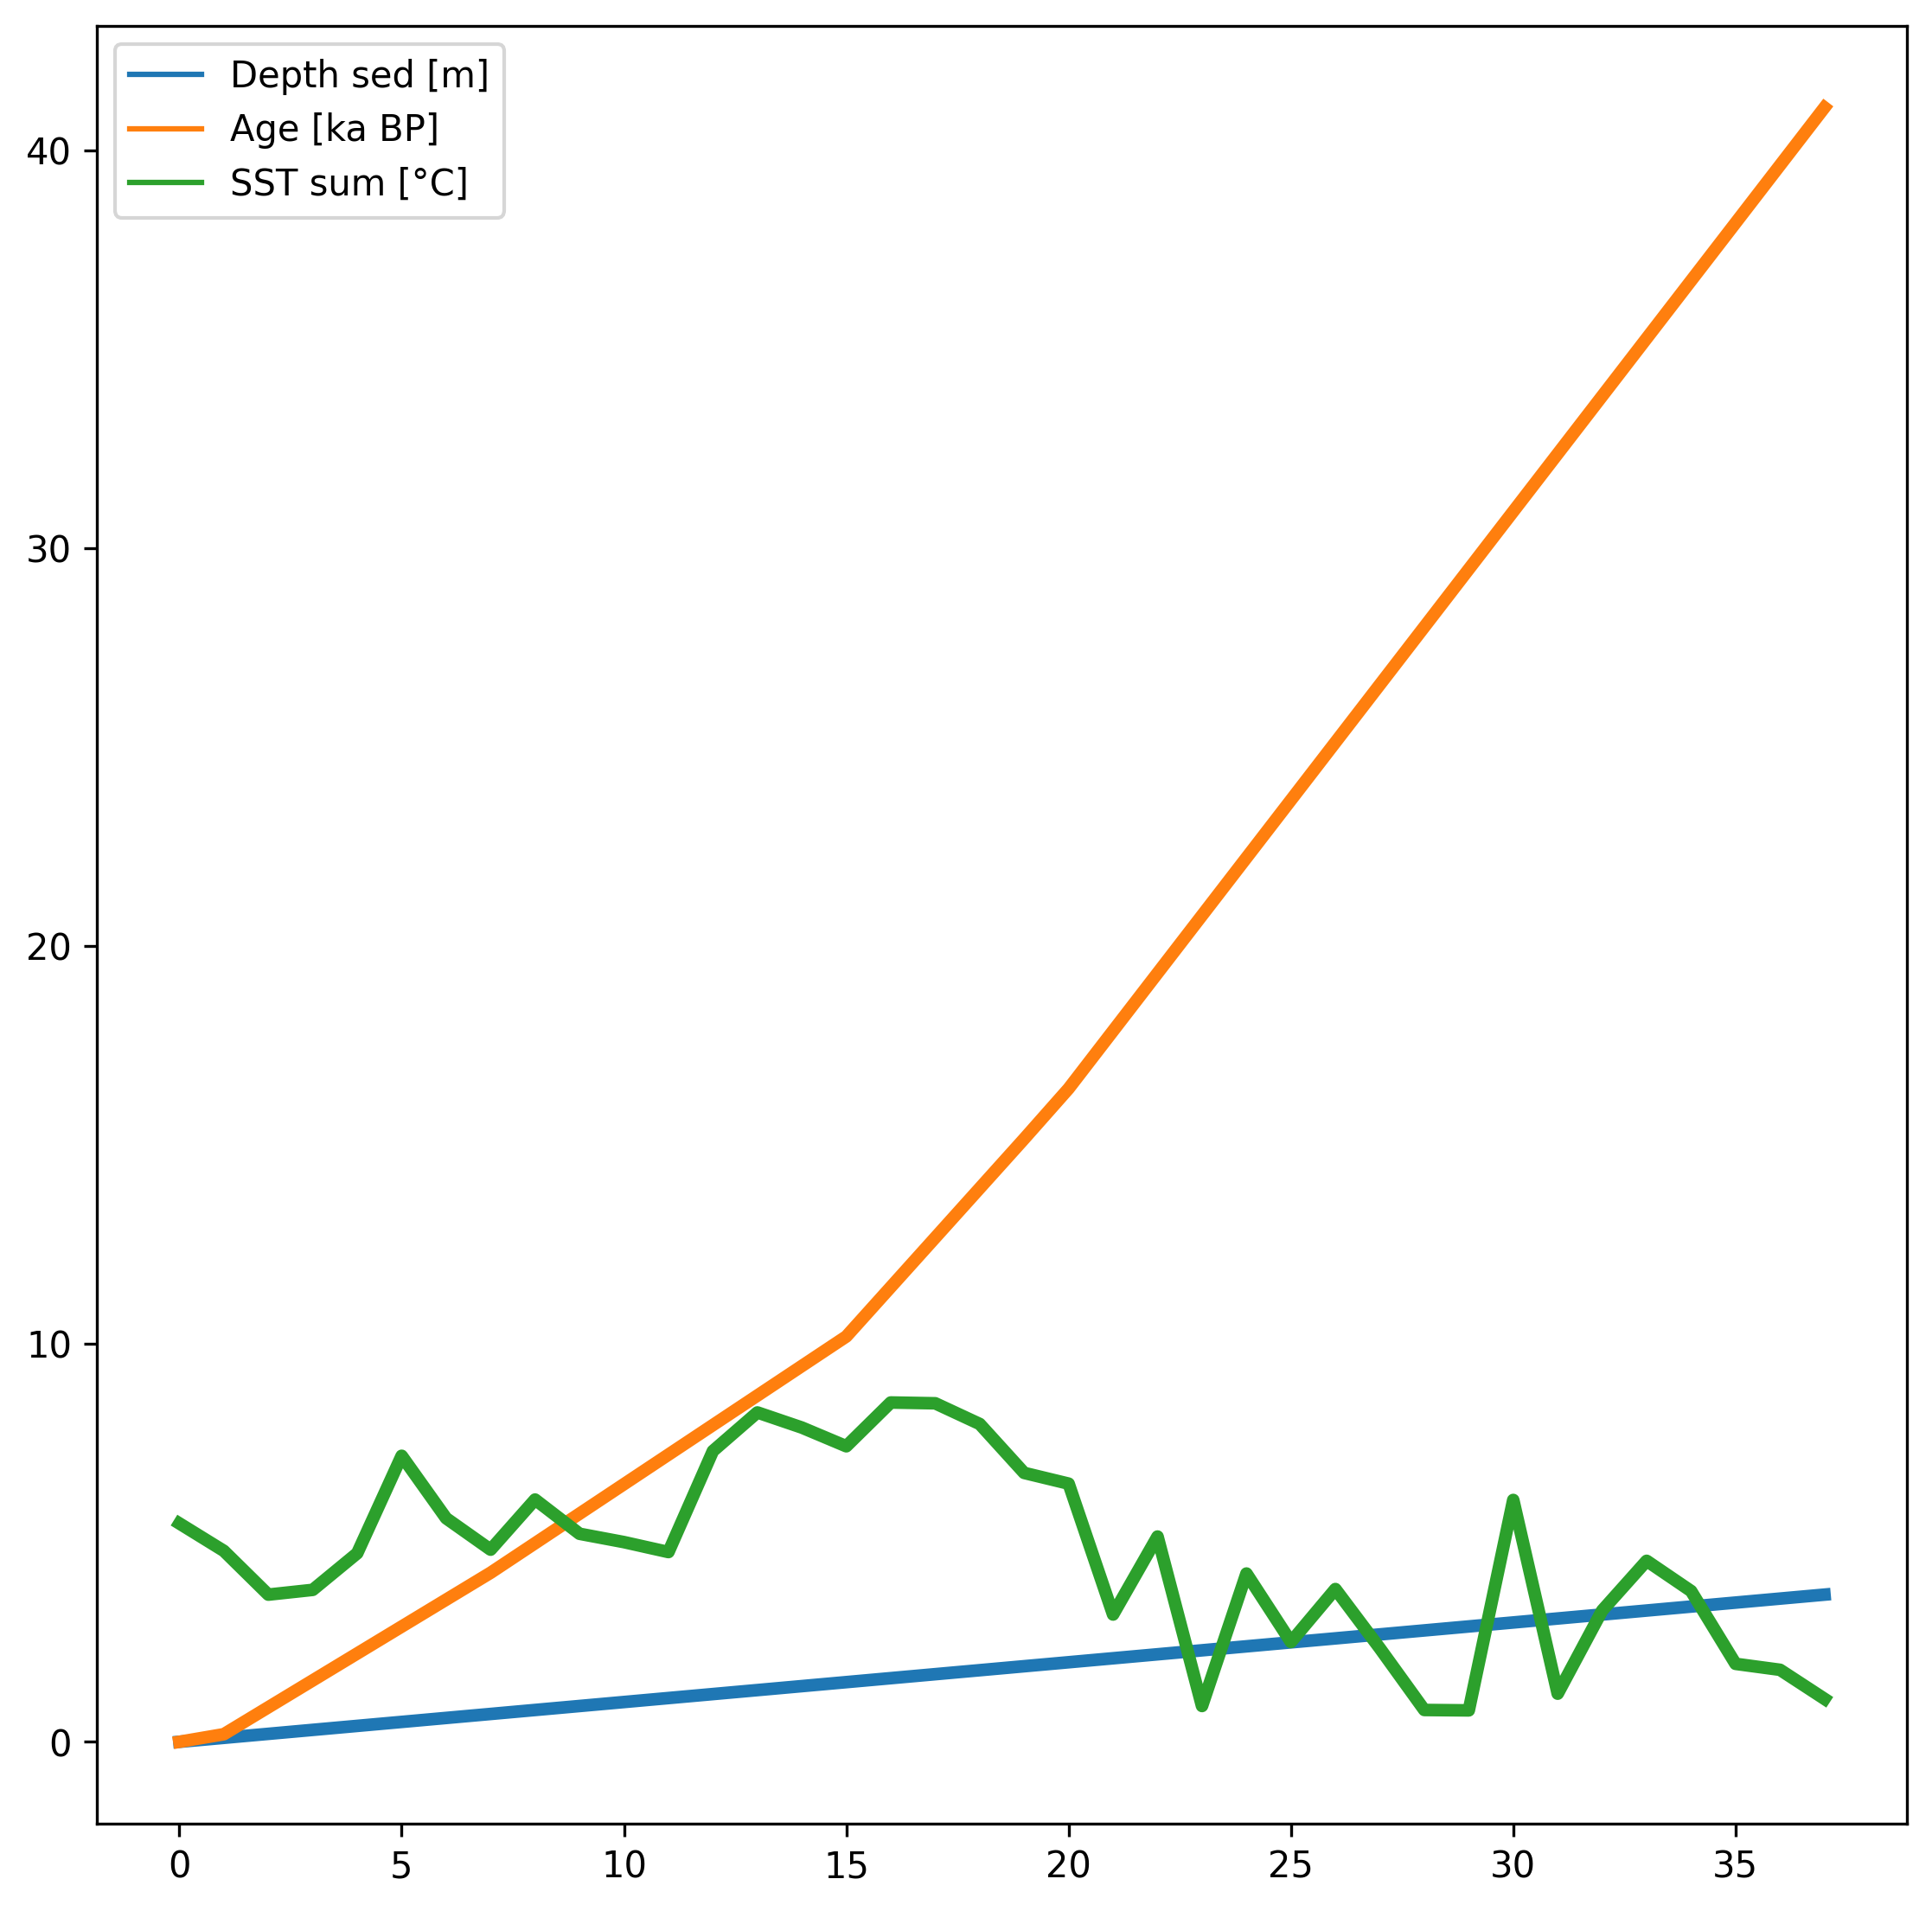
Diatom census counts were used to quantitatively estimate summer sea-surface temperatures (SST) over the last 40,000 years in core MD11-3353, collected in 2011 on board the R.V. Marion Dusfresne west of Kerguelen Island, Southern Ocean. The transfer function used to reconstruct summer (January to March) SST is the Modern Analog Technique that here uses 249 surface sediment samples (modern analogs), the relative abundances of 32 diatom species and the chord distance to select the five most similar modern analogs (Crosta et al., 2020). This method yields a root mean square error of prediction of ~1 °C. The core chronology is detailed in Thöle et al. (2019). RELATED PUBLICATION: Civel-Mazens, Matthieu; Crosta, Xavier; Cortese, Giuseppe; Michel, Elisabeth; Mazaud, Alain; Ther, Olivier; Ikehara, Minoru; Itaki, Takuya (2021): Impact of the Agulhas Return Current on the oceanography of the Kerguelen Plateau region, Southern Ocean, over the last 40 kyrs. Quaternary Science Reviews, 251, 106711, https://doi.org/10.1016/j.quascirev.2020.106711
-
AntAir ICE is an air temperature dataset for terrestrial Antarctica, the ice shelves, and the seasonal sea ice around Antarctica in a 1km2 spatial grid resolution and a daily temporal resolution available from 2003-2021. AntAir ICE was produced by modelling air temperature from MODIS ice surface temperature and land surface temperature using linear models. In-situ measurements of air temperature from 117 Automatic Weather Stations were used as the response variable. Each day has a bricked spatial raster with two layers, saved as a GeoTIFF format and in the Antarctic Polar Stereographic projection (EPSG 3031). The first layer is the predicted near surface air temperature for that day in degree Celsius * 10 and the second layer is the number of available MODIS scenes for that day ranging from 0 to 4. Areas with cloud contamination or without sea ice are marked with no data. Files for each year (2003-2021) are compressed with a ZIP files for each quarter. Python 3.8 was used for conversion of the MODIS products from HDF files to raster and all data handling and processing was thereafter done in R version 4.0.0. All data processing and modelling procedures are available as R scripts on a public Github repository: https://github.com/evabendix/AntAir-ICE. Using this code it is possible to download new available MODIS LST and IST scenes and apply the model to continue the near-surface air temperature dataset. Related Publication: https://doi.org/10.1038/s41597-023-02720-z GET DATA: https://doi.org/10.1594/PANGAEA.954750
-
The data are approximately 800 km of airborne electromagnetic survey of coastal sea ice and sub-ice platelet layer (SIPL) thickness distributions in the western Ross Sea, Antarctica, from McMurdo Sound to Cape Adare. Data were collected between 8 and 13 November 2017, within 30 days of the maximum fast ice extent in this region. Approximately 700 km of the transect was over landfast sea ice that had been mechanically attached to the coast for at least 15 days. Most of the ice was first-year sea ice. Unsmoothed in-phase and quadrature components are presented at all locations. Data have been smoothed with an 100 point median filter, and in-phase and quadrature smoothed data are also presented at all locations. Beneath level ice it is possible to identify the thickness of an SIPL and a filter is described (Langhorne et al) to identify level ice. Level ice in-phase, quadrature and SIPL thickness, derived from these, are presented at locations of level ice. For rough ice, the in-phase component is considered the best measure of sea ice thickness. For level ice where there is the possibility of an SIPL, then the quadrature component is considered the best measure of ice thickness, along with SIPL thickness. All data are in meters.
-
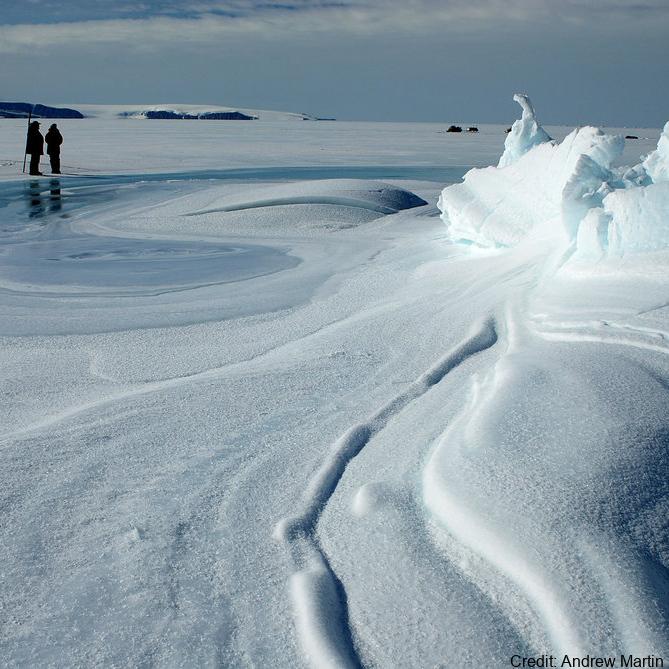
Sea ice temperature (°C) measured across multiple depths at (LATITUDE: -77.792300, LONGITUDE: 166.514900). RELATED PUBLICATION: https://doi.org/10.1017/jog.2022.108 GET DATA: https://doi.org/10.1594/PANGAEA.880164
-
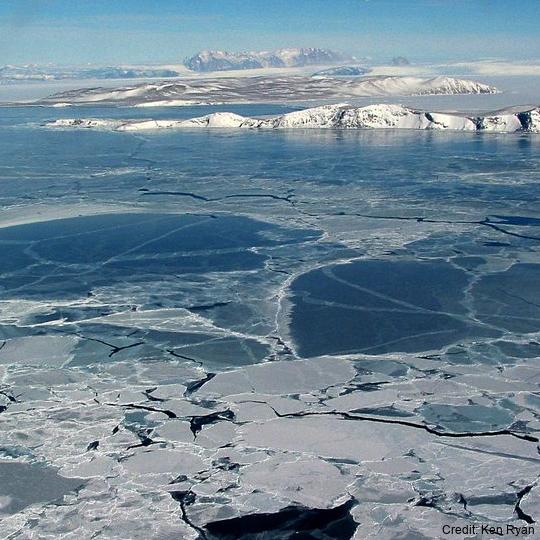
The data are approximately 800 km of airborne electromagnetic survey of coastal sea ice and sub-ice platelet layer (SIPL) thickness distributions in the western Ross Sea, Antarctica, from McMurdo Sound to Cape Adare. Data were collected between 8 and 13 November 2017, within 30 days of the maximum fast ice extent in this region. Approximately 700 km of the transect was over landfast sea ice that had been mechanically attached to the coast for at least 15 days. Most of the ice was first-year sea ice. Unsmoothed in-phase and quadrature components are presented at all locations. Data have been smoothed with an 100 point median filter, and in-phase and quadrature smoothed data are also presented at all locations. Beneath level ice it is possible to identify the thickness of an SIPL and a filter is described (Langhorne et al) to identify level ice. Level ice in-phase, quadrature and SIPL thickness, derived from these, are presented at locations of level ice. For rough ice, the in-phase component is considered the best measure of sea ice thickness. For level ice where there is the possibility of an SIPL, then the quadrature component is considered the best measure of ice thickness, along with SIPL thickness. All data are in meters.
-
The data are approximately 800 km of airborne electromagnetic survey of coastal sea ice and sub-ice platelet layer (SIPL) thickness distributions in the western Ross Sea, Antarctica, from McMurdo Sound to Cape Adare. Data were collected between 8 and 13 November 2017, within 30 days of the maximum fast ice extent in this region. Approximately 700 km of the transect was over landfast sea ice that had been mechanically attached to the coast for at least 15 days. Most of the ice was first-year sea ice. Unsmoothed in-phase and quadrature components are presented at all locations. Data have been smoothed with an 100 point median filter, and in-phase and quadrature smoothed data are also presented at all locations. Beneath level ice it is possible to identify the thickness of an SIPL and a filter is described (Langhorne et al) to identify level ice. Level ice in-phase, quadrature and SIPL thickness, derived from these, are presented at locations of level ice. For rough ice, the in-phase component is considered the best measure of sea ice thickness. For level ice where there is the possibility of an SIPL, then the quadrature component is considered the best measure of ice thickness, along with SIPL thickness. All data are in meters.