 Metadata Catalogue
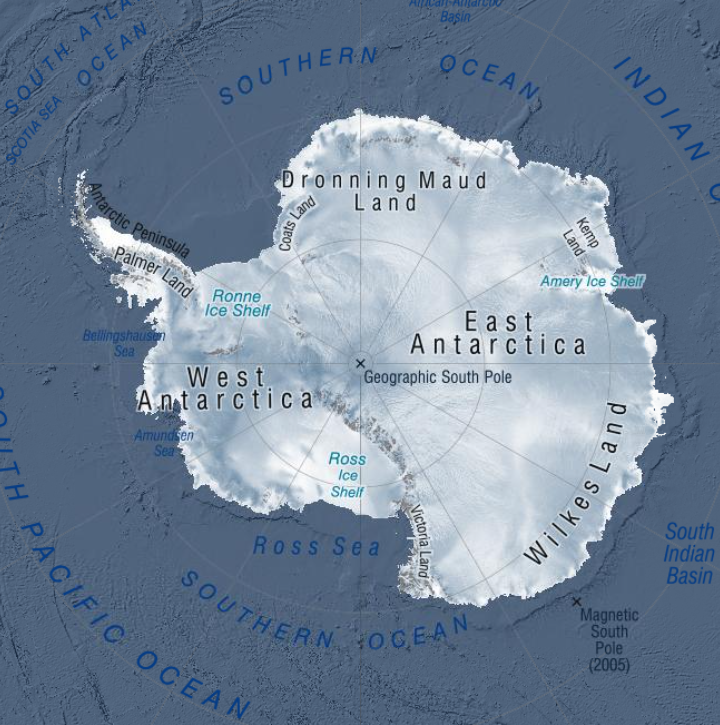
ANTARCTICA
Type of resources
Topics
Keywords
Contact for the resource
Provided by
Years
Update frequencies
status
-
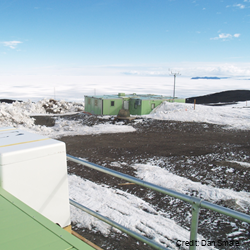
Ultraviolet radiation measurements over the spectral region 290-450 nm with a high precision spectro-radiometer. The spectro-radiometer was installed at Arrival Heights as a two month (November 2006 – January 2007) blind inter-comparison with the established measurement programme run by Biospherical Instruments for the USAP. The data was compared with the USAP data taken simultaneously. These data are held internally by NIWA. GET DATA: contact dan.smale@niwa.co.nz
-

A sea level recorder and barometer was installed at Scott Base in January 2001 initially to support oceanographic and hazards research (including tsunami) and to support hydrographic surveying. The sea-level recorder is a nitrogen bubbler system with a paroscientific pressure transducer located on a bottom-mounted spigot of the osmosis boom (to enable lifting for maintenance), that ensures the orifice always returns to the same point. Sea level and atmospheric pressure and temperature are recorded at 5 minute intervals and stored every 24 hours. Each year the rise and fall of the sea ice is observed over a 2-3 day period during a spring tide using GPS. These measurements are related to a tide gauge benchmark and the sea surface to enable the reliability of the tide gauge to be checked. GET DATA: https://sealevel-data.linz.govt.nz/index.html?tidegauge=SCOT
-
A tide gauge was installed in November 1990 and has been in near continuous operation since. A 10 minute average of water depth was recorded each hour with hourly averages of wind speed and direction, air temperature and solar radiation. From 2000 the recording frequency was increased from every hour to every 10 minutes. From 2003 data is read every 10 seconds and an average value (from 60 readings) is calculated every 5 minutes and recorded. Barometric pressure was measured as well, starting in 2003, with six barometric pressure readings made between 2 and 3 minutes in the 5-minute interval and averaged and recorded with the tide value. Each year the rise and fall of the sea ice is observed over a 2 - 3 day period during a spring tide using GPS. These measurements are related to a tide gauge bench mark and the sea surface to enable the reliability of the tide gauge to be checked. The tide gauge data is archived by Land Information New Zealand. GET DATA: https://sealevel-data.linz.govt.nz/index.html?tidegauge=ROBT
-
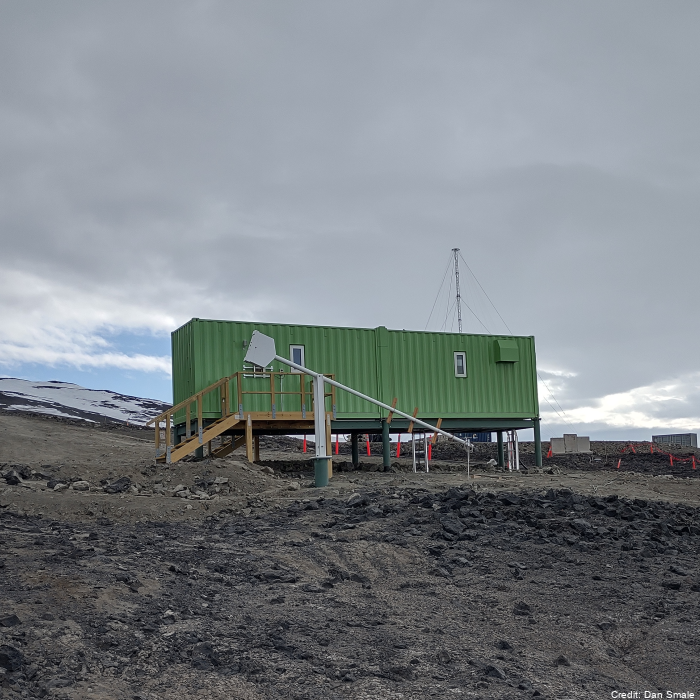
Measurements of chlorine monoxide (ClO) made with a Microwave Chlorine Monoxide Millimeter Wave Spectrometer (ground-based). The instrument (ClOe1) was established in January of 1996 at Scott Base and decommissioned in October 2023. A replacement radiometer (ClOe4) was installed at Scott Base in February 2023 (an overlap in the data for timeseries continuity purposes). These data are produced in collaboration with State University of New York (SUNY) Stoney Brook and Naval Research Laboratory (NRL). “Raw” data are times and recorded microwave emission spectra. “Derived” data are column amounts and vertical profile information of chlorine monoxide (ClO). The instrument has acquired the nickname "CloeTechnique" for vertical profile information uses "optimal estimation" to extract information from pressure broadening of ClO emission line. Significant failure in early 2018 only fixed in November 2018. No data in the July - October 2018 period. Data is held at NRL and in the NDACC database. Data are available as monthly .ndm files, and additional metadata are available in the header. Instrument timeline: - ClOe1 1996-2023 - ClOe4 2023 – present GET DATA: https://www-air.larc.nasa.gov/missions/ndacc/data.html?station=scott.base#
-
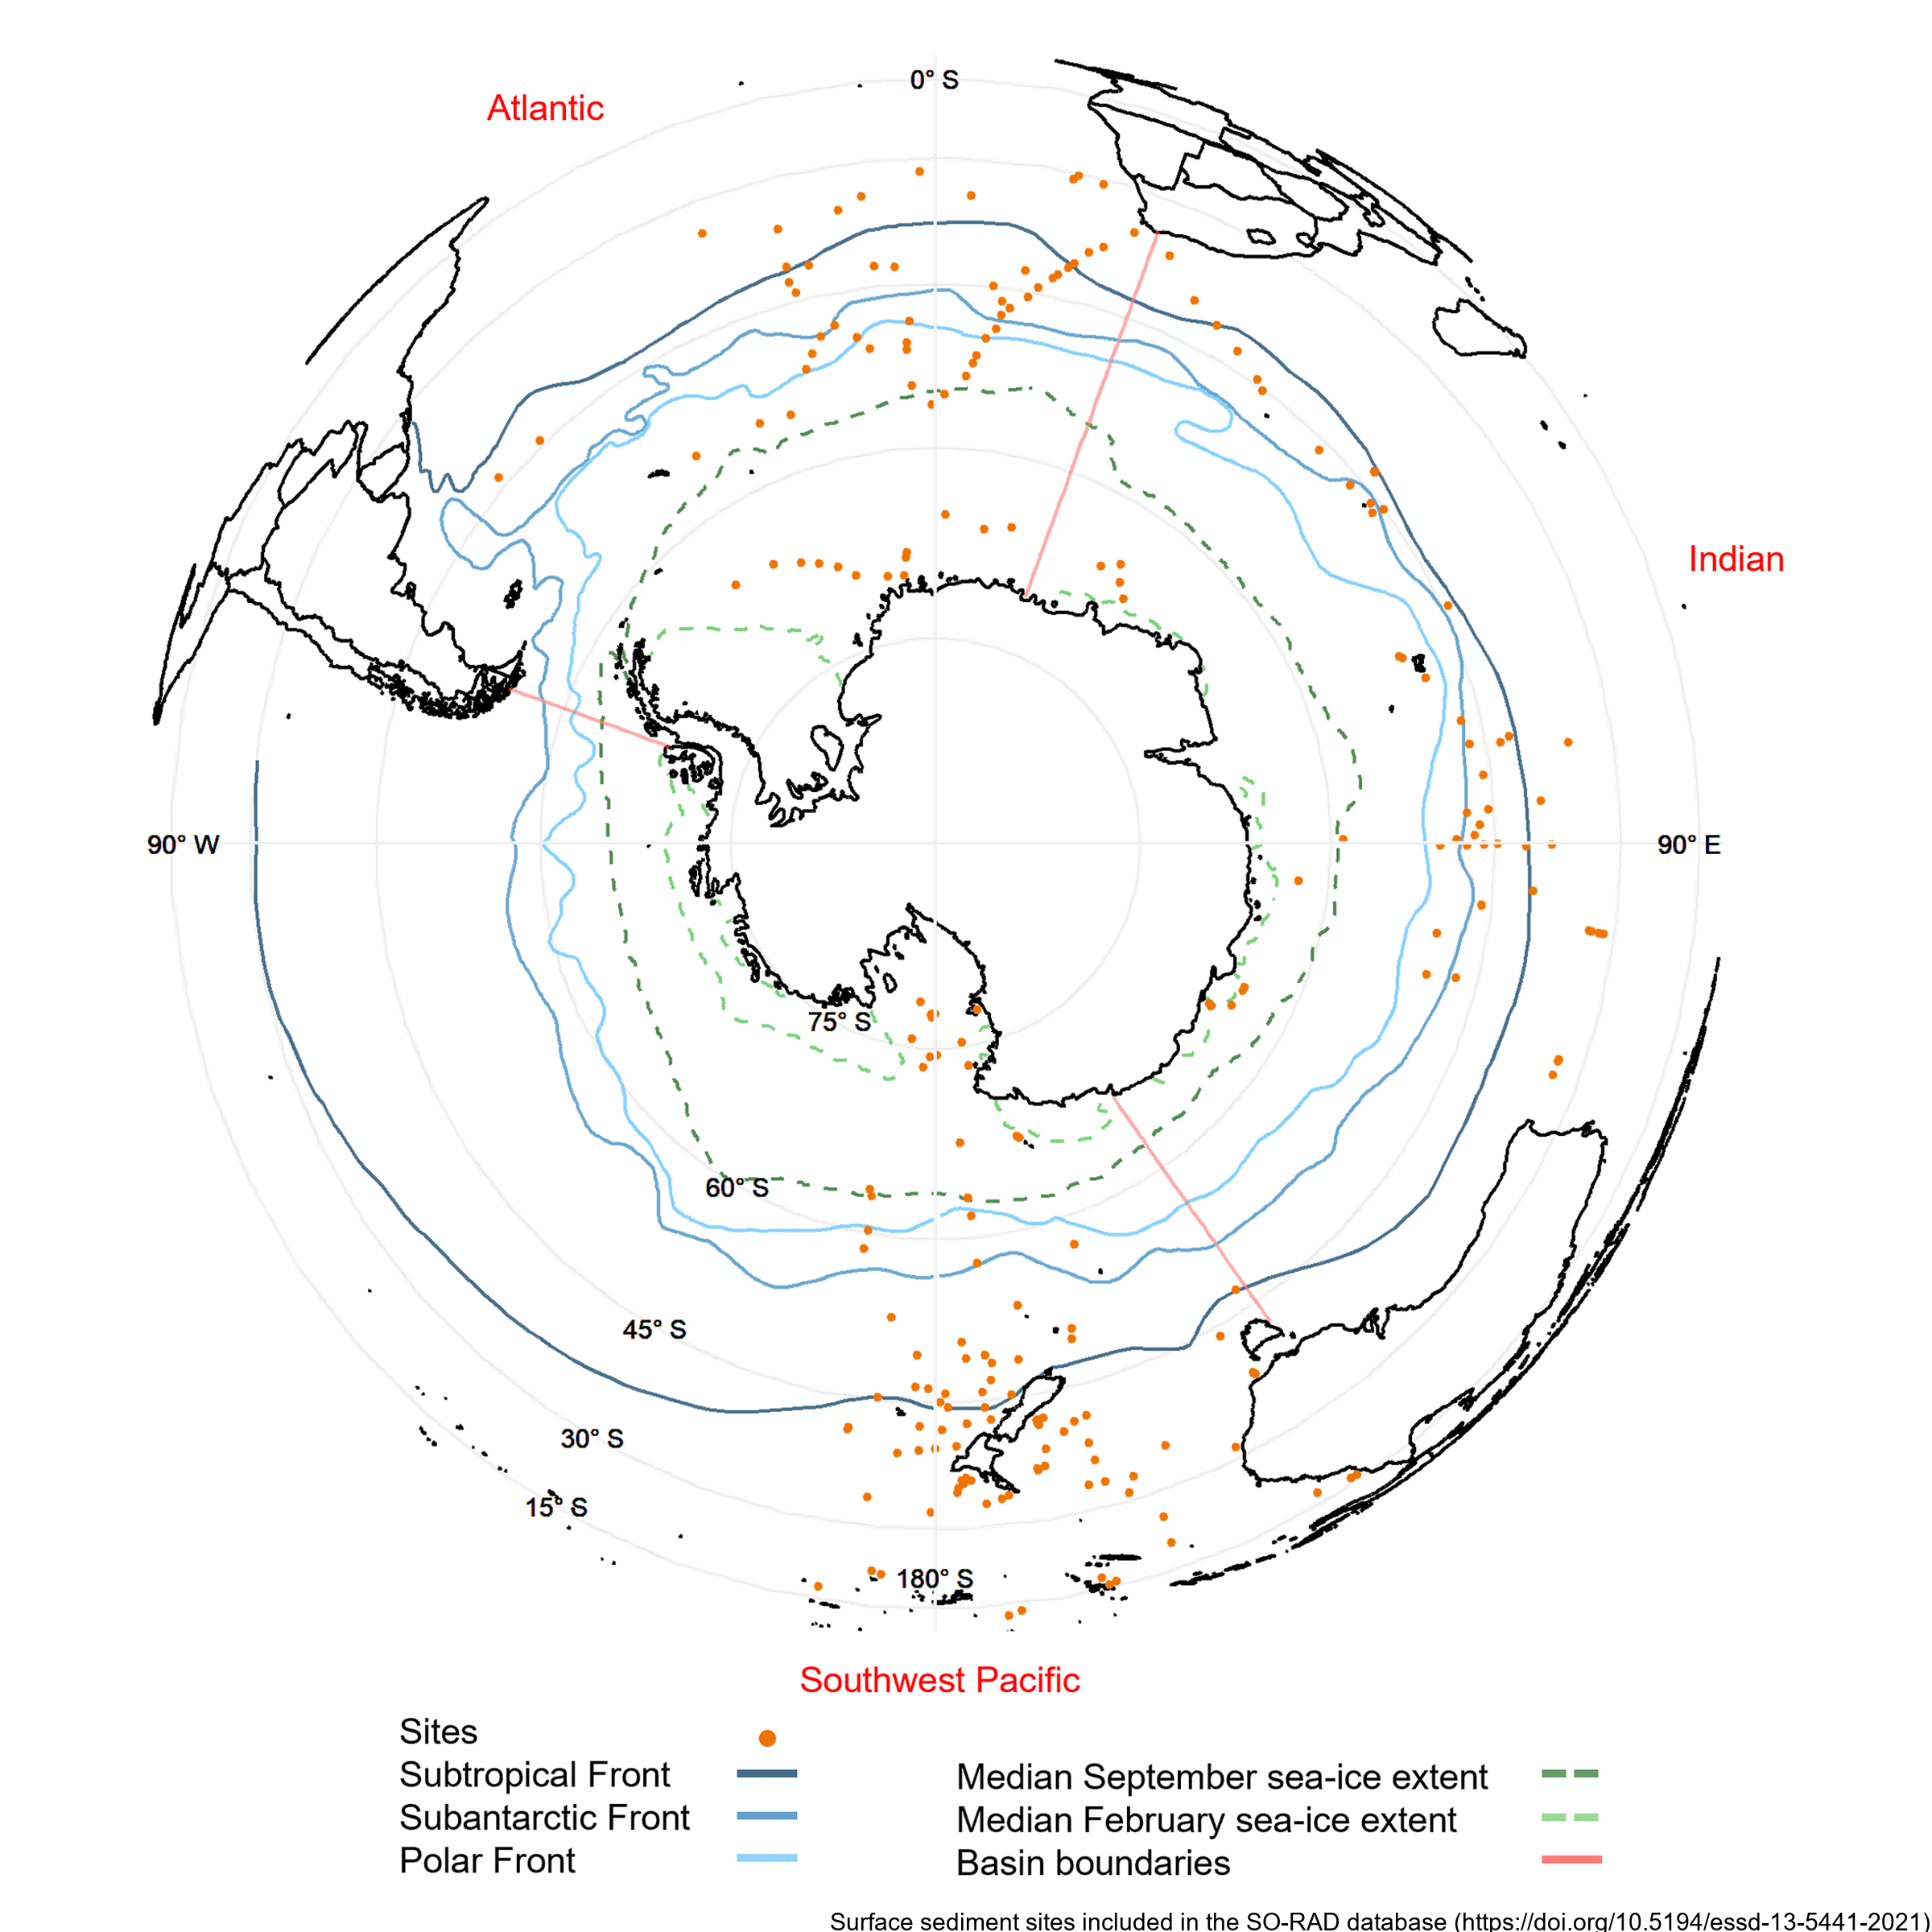
Radiolarians (holoplanktonic Protozoa) found in marine sediments are commonly used in Southern Ocean as palaeoclimate proxies. Generating such reconstructions of past climate based on radiolarian abundances requires a spatially and environmentally comprehensive reference dataset of modern radiolarian census counts. The Southern Ocean RADiolarian (SO-RAD) dataset includes census counts for 237 radiolarian taxa from 228 surface sediment samples located in the Atlantic, Indian and South-west Pacific sectors of the Southern Ocean. This compilation is the largest radiolarian census dataset derived from surface sediment samples in the Southern Ocean. The SO-RAD dataset may be used as a reference dataset for palaeoceanographic reconstructions, or for studying modern radiolarian biogeography and species diversity. RELATED PUBLICATION: https://doi.org/10.5194/essd-13-5441-2021
-
AntAir ICE is an air temperature dataset for terrestrial Antarctica, the ice shelves, and the seasonal sea ice around Antarctica in a 1km2 spatial grid resolution and a daily temporal resolution available from 2003-2021. AntAir ICE was produced by modelling air temperature from MODIS ice surface temperature and land surface temperature using linear models. In-situ measurements of air temperature from 117 Automatic Weather Stations were used as the response variable. Each day has a bricked spatial raster with two layers, saved as a GeoTIFF format and in the Antarctic Polar Stereographic projection (EPSG 3031). The first layer is the predicted near surface air temperature for that day in degree Celsius * 10 and the second layer is the number of available MODIS scenes for that day ranging from 0 to 4. Areas with cloud contamination or without sea ice are marked with no data. Files for each year (2003-2021) are compressed with a ZIP files for each quarter. Python 3.8 was used for conversion of the MODIS products from HDF files to raster and all data handling and processing was thereafter done in R version 4.0.0. All data processing and modelling procedures are available as R scripts on a public Github repository: https://github.com/evabendix/AntAir-ICE. Using this code it is possible to download new available MODIS LST and IST scenes and apply the model to continue the near-surface air temperature dataset. Related Publication: https://doi.org/10.1038/s41597-023-02720-z GET DATA: https://doi.org/10.1594/PANGAEA.954750
-
Sea ice temperature (°C) measured across multiple depths at (LATITUDE: -77.792300, LONGITUDE: 166.514900). RELATED PUBLICATION: https://doi.org/10.1017/jog.2022.108 GET DATA: https://doi.org/10.1594/PANGAEA.880164
-
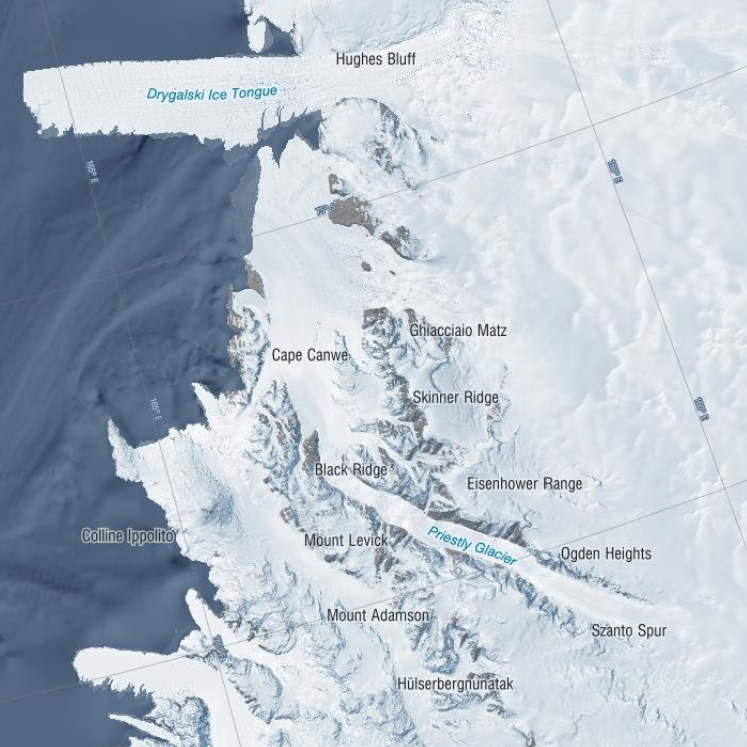
This is GNSS data of four stations covering the grounding zone of Priestley Glacier Antarctica. Tidal modulation of ice streams and their adjacent ice shelves is a real-world experiment to understand ice-dynamic processes. We observe the dynamics of Priestley Glacier, Antarctica, using Terrestrial Radar Interferometry (TRI) and GNSS. Ocean tides are predominantly diurnal but horizontal GNSS displacements oscillate also semi-diurnally. The oscillations are strongest in the ice shelf and tidal signatures decay near-linearly in the TRI data over >10 km upstream of the grounding line. Tidal flexing is observed >6 km upstream of the grounding line including cm-scale uplift. Tidal grounding line migration is small and <40 % of the ice thickness. The frequency doubling of horizontal displacements relative to the ocean tides is consistent with variable ice-shelf buttressing demonstrated with a visco-elastic Maxwell model. Taken together, this supports previously hypothesized flexural ice softening in the grounding-zone through tides and offers new observational constraints for the role of ice rheology in ice-shelf buttressing. Related Publication: Drews, R., Wild, C. T., Marsh, O. J., Rack, W., Ehlers, T. A., Neckel, N., & Helm, V. (2021). Grounding-zone flow variability of Priestley Glacier, Antarctica, in a diurnal tidal regime. Geophysical Research Letters, 48, e2021GL093853. https://doi.org/10.1029/2021GL093853 GET DATA: https://doi.pangaea.de/10.1594/PANGAEA.936090
-
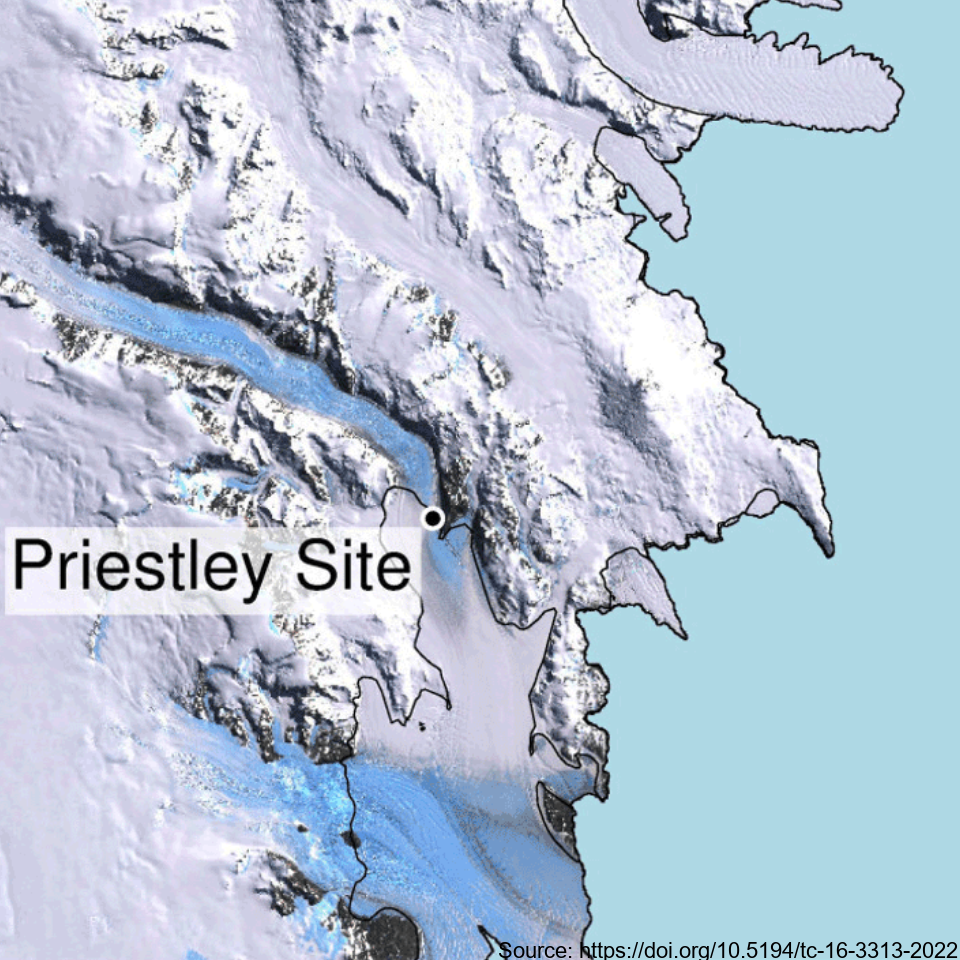
This metadata record represents the first direct comparison of seismic and ultrasonic data with measured crystallographic preferred orientations Crystallographic preferred orientations (CPO) in a polar shear margin (Priestly Glacier, Antarctica). Analyses of seismic, ultrasonic and measured CPO datasets were combined to assess the potential of active-source seismic surveys for the constraint of shear margin anisotropy, which provide an assessment of ice flow dynamics and stability. A continuous ice core of 58 m length was drilled and recovered in December 2019 and January 2020 in a lateral shear margin of the Priestley Glacier, located in Victoria Land, Antarctica. Core samples were analysed for CPO using electron backscatter diffraction (EBSD) measurements. The core orientation was carefully preserved during drilling, which enabled azimuthal orientation of the CPO. To complete the link between seismic anisotropy of the ice volume around the borehole and CPO measurements from the core, multi-azimuthal ultrasonic velocity measurements were made on core samples in the laboratory. The vertical-seismic-profile (VSP) dataset was recorded at the Priestley drill site using a three-component borehole seismometer to investigate seismic properties and anisotropy within the glacier ice. Additionally, multi-azimuthal ultrasonic velocity measurements were conducted on core samples in the laboratory, complementing the seismic data analysis. Further details are provided at: Lutz, F., Prior, D.J., Still, H., Hamish Bowman, M., Boucinhas, B., Craw, L., Fan, S., Kim, D., Mulvaney, R., Thomas, R.E., & Hulbe, C.L. (2022). Ultrasonic and seismic constraints on crystallographic preferred orientations of the Priestley Glacier shear margin, Antarctica. *Cryosphere*, 16(8), 3313-3329. https://doi.org/10.5194/tc-16-3313-2022 GET DATA: https://auckland.figshare.com/articles/dataset/Priestley_Glacier_seismic_and_ultrasonic_constraints_on_crystallographic_orientation/17108639
-
This data publication contains biostratigraphic age events for the CIROS-1 drill core, updated age ranges for a suite of samples from the McMurdo erratics sample collection, age-depth tie points for CIROS-1, CRP-2/2A, DSDP 270, DSDP 274, ANDRILL 2A and ANDRILL 1B, and glycerol dialkyl glycerol tetraethers (GDGTs) abundances and indices for samples from the McMurdo erratics, CIROS-1, CRP-2/2A, DSDP 270, DSDP 274, ANDRILL 2A, and ANDRILL 1B. All sample sites are in the Ross Sea region of Antarctica. The McMurdo erratics are glacial erratics collected in the McMurdo Sound region between 1991 and 1996 (Harwood and Levy, 2000). The CIROS-1 drill core was collected from McMurdo sound in 1986 with samples spanning the upper Eocene to lower Miocene. CRP-2/2A drill core was collected in 1999 from offshore Victoria Land with samples for this study from the upper Oligocene-lower Miocene. DSDP Site 270 was recovered from the Eastern Basin of the central Ross Sea in 1973, with samples spanning the upper Oligocene-lower Miocene. DSDP Site 274 was drilled on the lower continental rise in the northwestern Ross Sea in 1973, and samples for this study have been taken from the middle Miocene sections of the drill core. The ANDRILL-2A core was recovered in 2007 from Southern McMurdo Sound, samples span the lower Miocene to middle Miocene and data was originally published in Levy et al. (2016). The ANDRILL-IB core was drilled from the McMurdo Ice Shelf in 2006, samples are compiled from the Plio-Pleistocene section of the core and were originally published in McKay et al. (2012). Biostratigraphic age events are described for CIROS-1, expanding on and updating previously published age models and biostratigraphic ranges. Ages are also revised for the McMurdo erratics by updating the ages of the biostratigraphic markers described by (Harwood and Levy (2000) to more recently published age ranges. Age models for the sample sites are developed using published age datums and the Bayesian age-depth modelling functionality in the R package Bchron (Haslett and Parnell, 2008) to ensure a consistent approach for assigning ages to core depths between datums. GDGT abundances and indices for Ross Sea sites are presented to reconstruct ocean temperatures over the Cenozoic era. Detailed methodology for the processing and analysis of samples for GDGTs is described in the methods section of supplement paper.