 Metadata Catalogue
2023
Type of resources
Topics
Keywords
Contact for the resource
Provided by
Years
Update frequencies
status
-

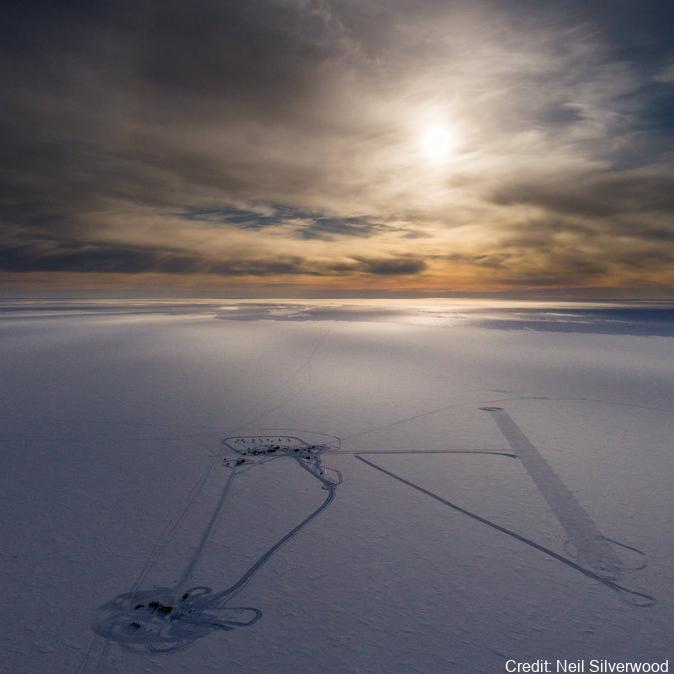
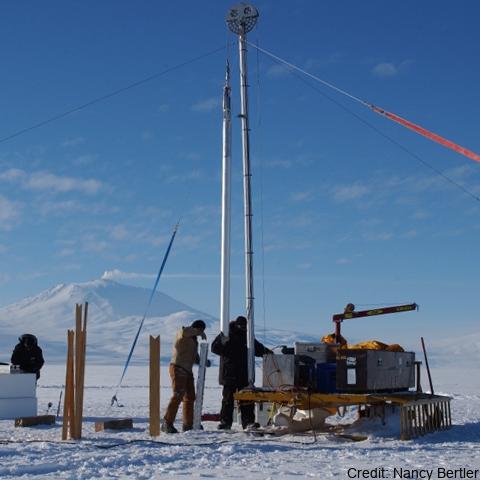
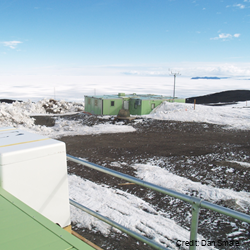
Climate data have been collected at Scott Base continuously since 1957 and more recently from Arrival Heights and is one of the longest continuous climate records in Antarctica. Climate parameters measured include: wind speed and direction, air temperature, relative humidity, barometric pressure, and global, diffuse and direct solar radiation. Climate data are collected on a daily basis from both sites. At Scott Base, this takes two forms: a standard daily observation at 0900 NZDT, and continuous data collection at 10 minute and hourly intervals using a CR10X data logger. The initial record of the 0900 daily observations began on 1 March 1957 with air temperature, air pressure, wind speed and direction, and global solar radiation being measured with standard instrumentation (wind measurements since 1972). This record constitutes the reference record. In January 1997 an electronic weather station (EWS) was added to collect and archive 10 minute and hourly data. The daily manual observations continued so as to provide a continuous reference and daily record. Historically, Arrival Heights only had a wind recorder (since January 1984). A data logger was installed in January 1999 and measured air temperature, relative humidity and global solar radiation using a secondary network sensor, as well as wind speed and direction. A barometric pressure sensor was installed in 2001. A standard 10m mast was installed and all sensors were moved to the new Arrival Heights laboratory in 2007. 10-minute and hourly data are recorded. Data are retrieved and archived from both automatic stations daily, as well as manual observations from Scott Base and available on New Zealand's national climate database. From February 2019, mercury theremometers and barometers were removed from Scott Base and Arrival Heights. Where applicable, these were replaced with electronic instruments. A weighing precipitation gauge was also installed in February 2019 for the measurement of solid precipitation at Scott Base. GET DATA: https://cliflo.niwa.co.nz/
-
This metadata record represents the data for generated by mining single-cell genomic, transcriptomic, and metagenomic data to uncover the viral diversity, biogeography, activity, and their role as metabolic facilitators of microbes beneath the Ross Ice Shelf. Hot drilling and seawater sampling was conducted from the sub-shelf water column in the central region of the RIS (Latitude −80.6577 N, Longitude 174.4626 W). The sampling site was located ≈300 km from the shelf front. A borehole (30 cm diameter) conducted by hot water drilling was used for direct sampling of seawater from three depths (400 m, 550 m, and 700 m from the top of the shelf, which correspond to 30 m, 180 m, and 330 m from the bottom of the ice shelf, respectively). Seawater samples were processed accordingly for single cell genomics, metagenomics, and transcriptomics as described5, and the resulting assembled and co-assembled contigs (min. length 1 kb) from single-amplified genomes, bins and transcriptomics were mined for detecting viral contigs. Further details are provided at https://doi.org/10.1038/s41467-023-44028-x GET DATA: https://doi.org/10.6084/m9.figshare.24581331
-
Aerial reconnaissance and photography are used in the Ross Sea sector of Antarctica to determine the breeding locations of Adélie penguins and to count the numbers of nests occupied during the early incubation period. From 1981 to present (two-year embargo), all islands and sea coasts between 158°E and 175°E have been searched, and 11 previously unreported breeding colonies discovered. The aim is to census Adélie (Pygoscelis adeliae) populations to provide basic data against which future population levels can be compared in order to monitor environmental change of the Antarctic Ocean ecosystem, both natural and man-induced. GET DATA: https://datastore.landcareresearch.co.nz/en_AU/dataset/adelie-penguin-census-data
-
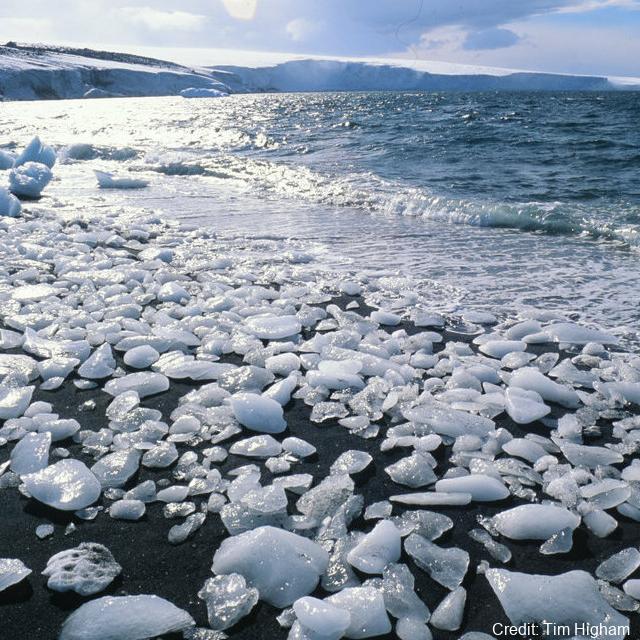
Here, we present a decadally resolved record of sea-salt sodium (a proxy for open-ocean area) and non-sea salt calcium (a proxy for continental dust) from the well-dated Roosevelt Island Climate Evolution (RICE) core, focusing on the time period between 40–26 ka BP. Drilling site coordinates: (79.364° S, 161.706°W). Further collection details can be found at https://doi.org/10.1038/s41467-023-40951-1
-

This metadata record represents the R phytoclass package. Determine the chlorophyll a (Chl a) biomass of different phytoplankton groups based on their pigment biomarkers. The method uses non-negative matrix factorisation and simulated annealing to minimise error between the observed and estimated values of pigment concentrations (Hayward et al. (2023) https://doi.org/10.1002/lom3.10541). The approach is similar to the widely used 'CHEMTAX' program (Mackey et al. 1996) https://doi.org/10.3354/meps144265), but is more straightforward, accurate, and not reliant on initial guesses for the pigment to Chl a ratios for each phytoplankton group. Further details are provided at: Hayward, A., M. H. Pinkerton, and A. Gutierrez-Rodriguez. 2023. phytoclass: A pigment-based chemotaxonomic method to determine the biomass of phytoplankton classes. Limnol. Oceanogr. Methods 21: 220–241. https://doi.org/10.1002/lom3.10541 GET PACKAGE: https://cran.r-project.org/web/packages/phytoclass/readme/README.html
-
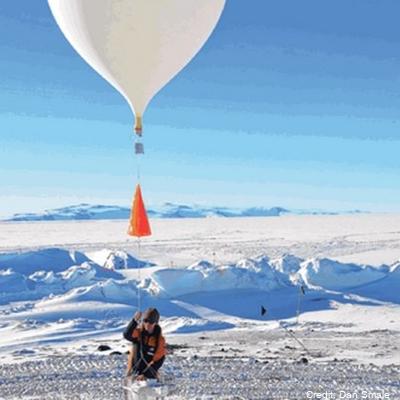
Altitude profile measurements of water vapour, ozone and aerosols using balloon packages flown through the troposphere into the stratosphere as part of the Ross Island GRUAN site activities. Maximum altitude recorded was 29 km. This project is a collaboration between the National Institute of Water and Atmospheric Research (NIWA) and NOAA. Timeline: - November 2022: 2 flights - February 2023: 1 flight - October 2023: 3 flights Data are held internally at NIWA and NOAA, and will be stored in the GRUAN database (https://www.gruan.org/data) GET_DATA: https://www.gruan.org/data
-
Ultraviolet radiation measurements over the spectral region 290-450 nm with a high precision spectro-radiometer. The spectro-radiometer was installed at Arrival Heights as a two month (November 2006 – January 2007) blind inter-comparison with the established measurement programme run by Biospherical Instruments for the USAP. The data was compared with the USAP data taken simultaneously. These data are held internally by NIWA. GET DATA: contact dan.smale@niwa.co.nz
-
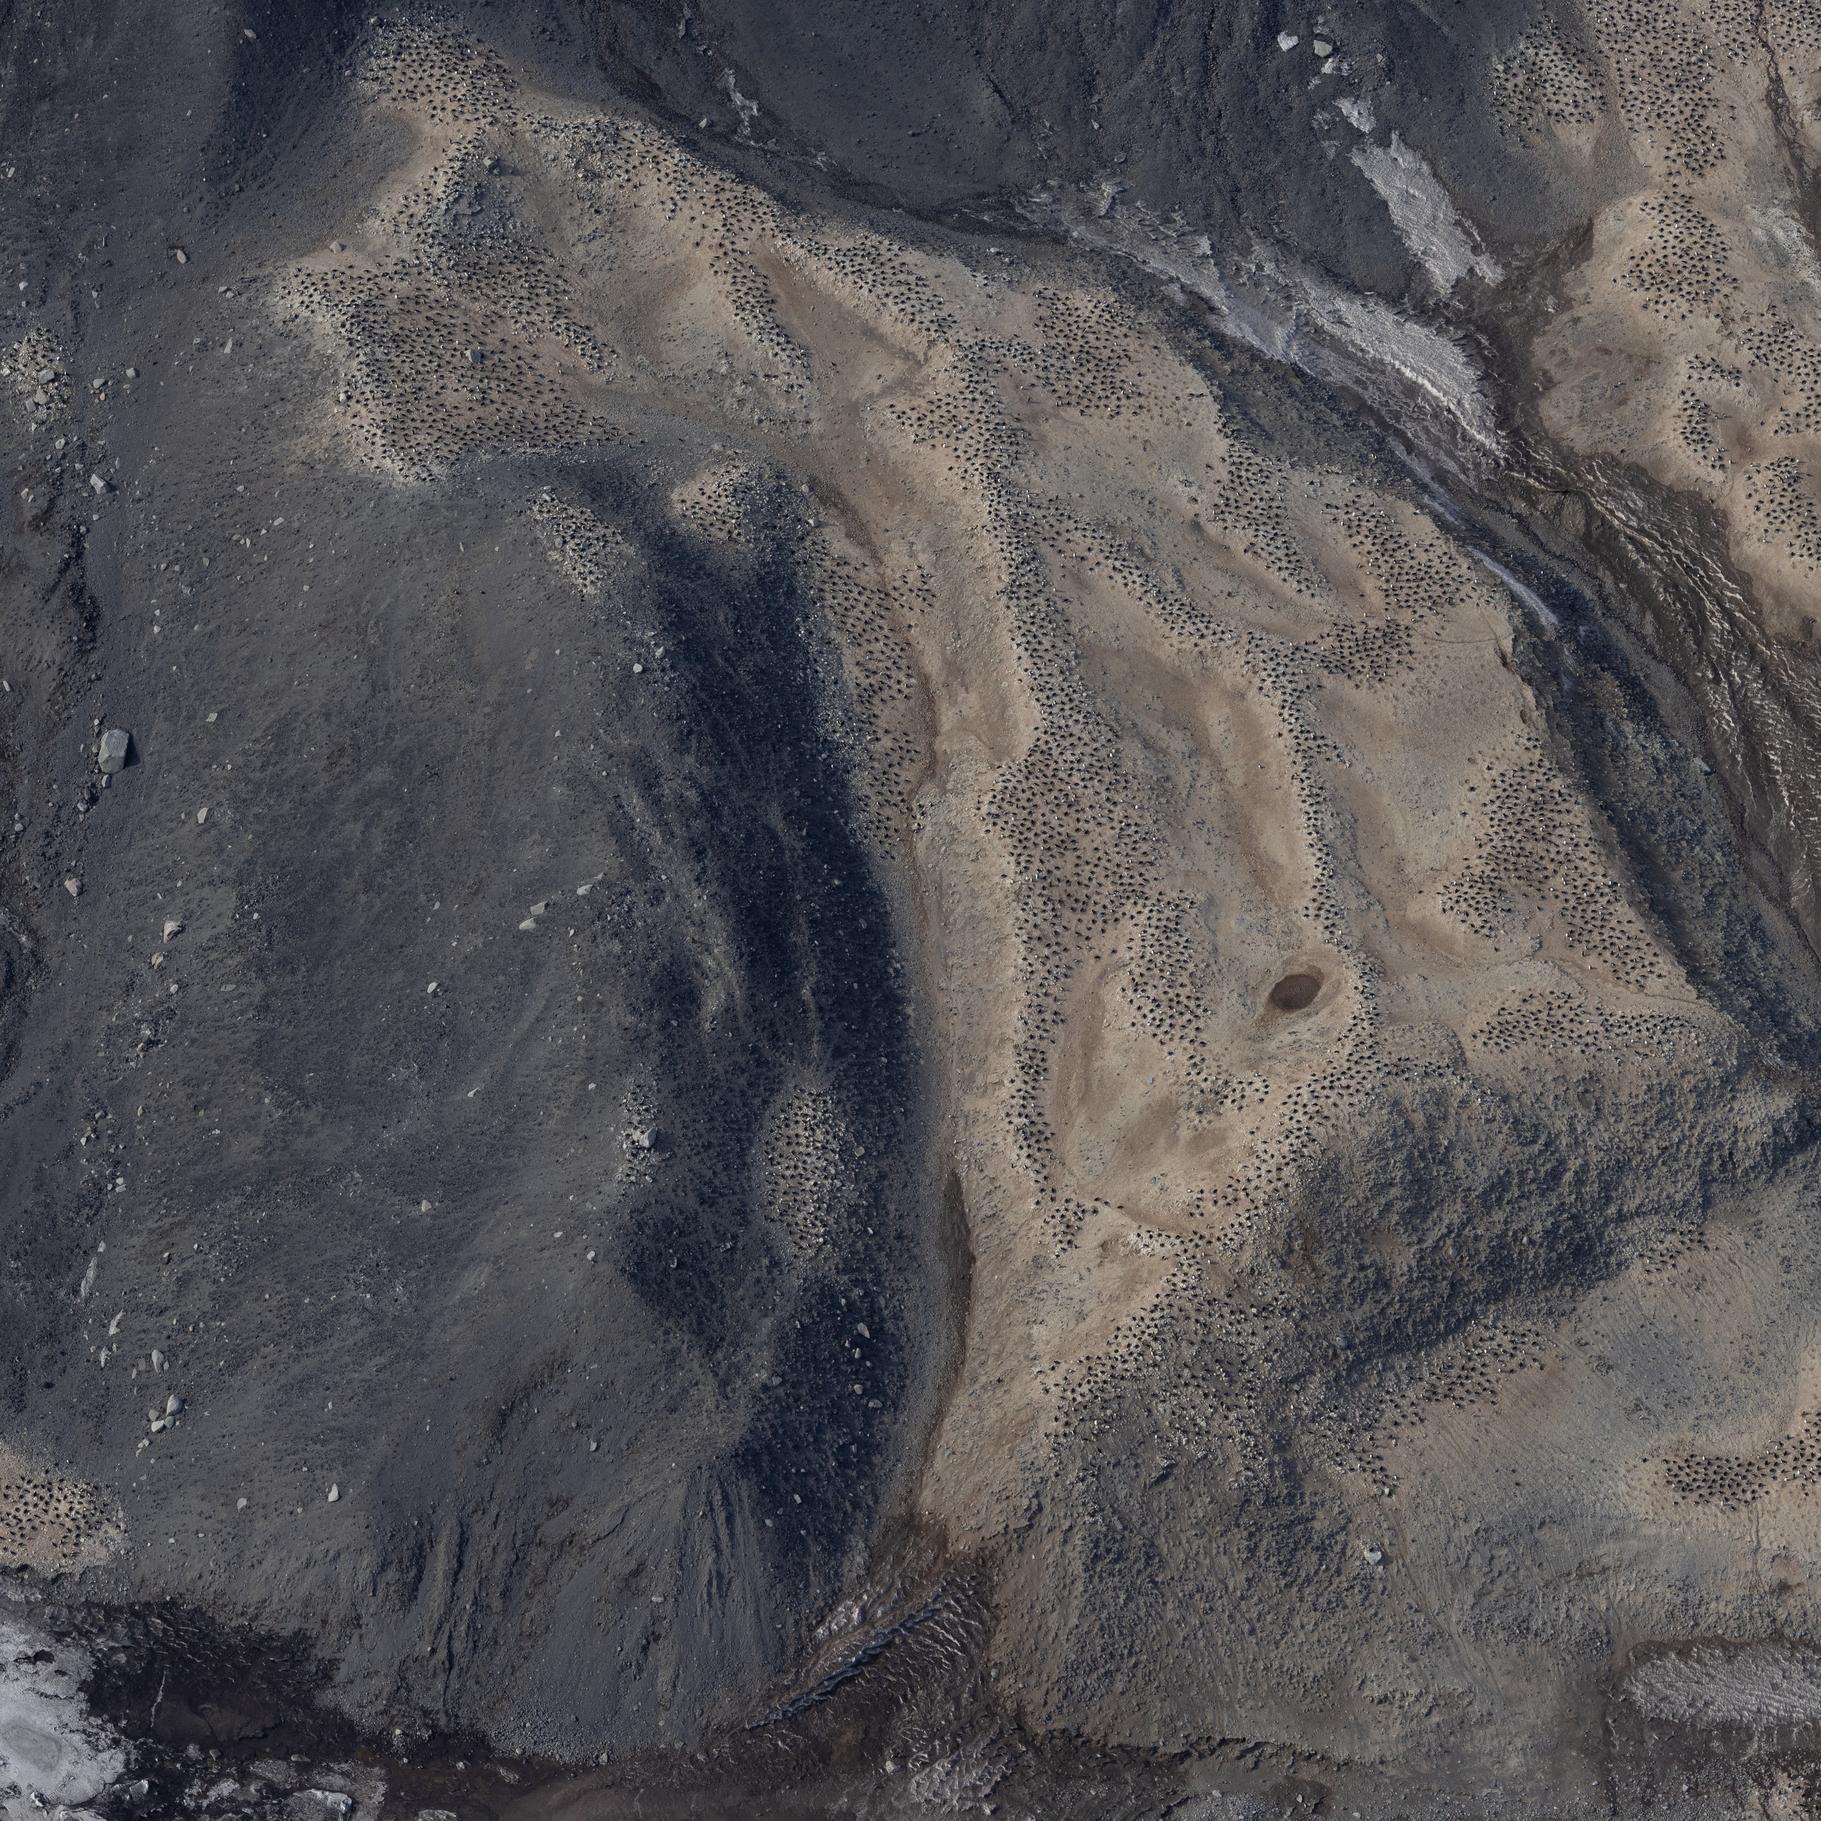
Raw images (over approximately 20.000 unique images) collected during the Adelie Penguin Census across 30+ colonies since 1981 (see associated metadata resource for list full list of colonies). Photographs were taken using a black and white film camera from 1981 to 2004 (inclusive) and 2008. Images are available in .tif fomrat. Images are digital from 2005 onwards (except 2008). Raw images are available in cr2/cr3 formats, and processed images are available across tif and jpg formats. High resolution scanning was initiated in 2011 to scan all the negatives in the collection. There are approximately 10,000 negatives in the collection. Images are taken from helicopter at between 2000-2500 feet. All images collected during the 2324 season are georeferenced with latitude and longitude positions in decimal degrees (WGS 84). Camera Settings: ISO = 400 Shutter speed = greater than 1/1000 Focus = manual, pre-focus to 800m Lens = 135mm with UV filter Aperture/ Exposure = F8 (or up to F11) Image Size = Full size White Balance Setting = Daylight Captures per minute = ~80 GET DATA: m.meredyth-young@antarcticanz.govt.nz
-
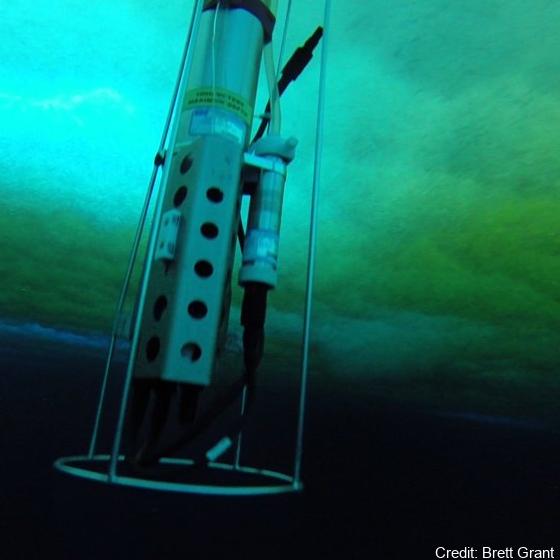
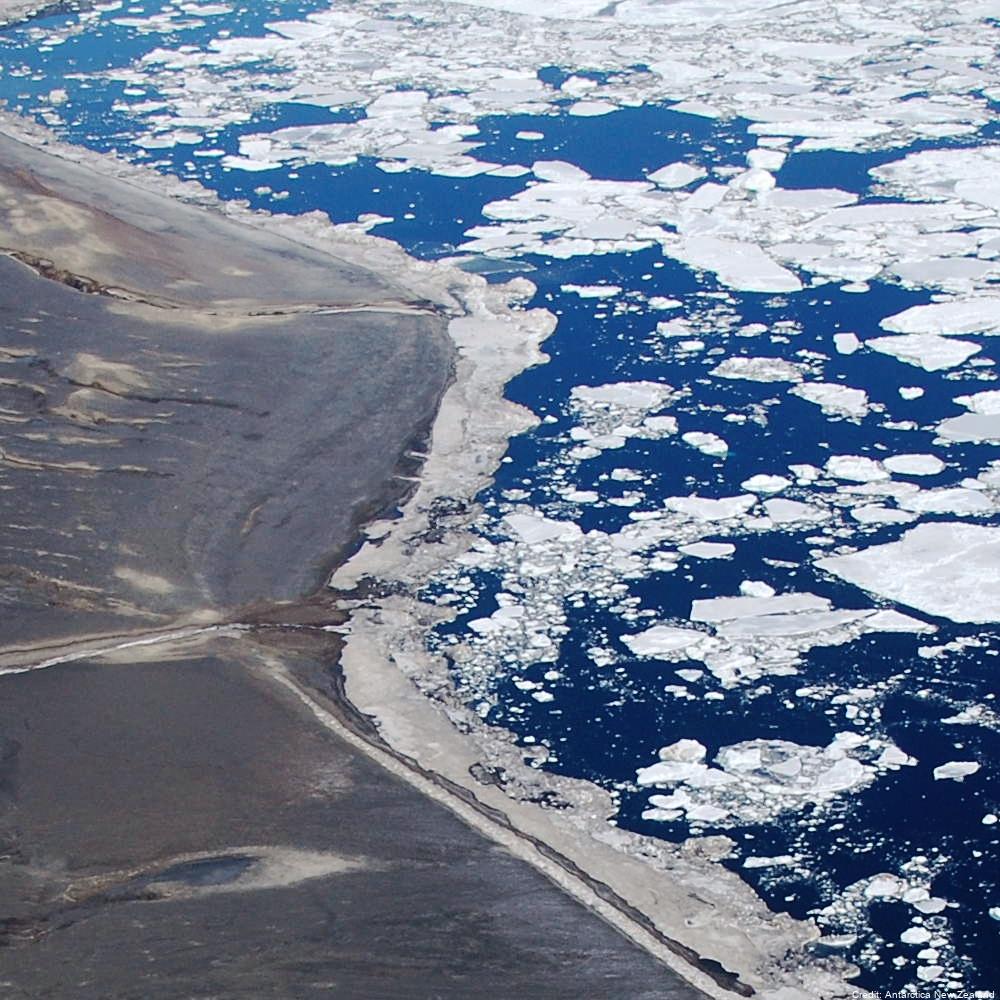
Data from a measurement campaign examining the oceanic connection between an ice shelf cavity and sea ice. Here we present data from the ocean boundary-layer in an Ice Shelf Water outflow region from the Ross/McMurdo Ice Shelves. From a fast ice field camp during the Spring of 2015, we captured the kinematics of free-floating relatively large (in some cases 10s of mm in scale) ice crystals that were advecting and then settling upwards in a depositional layer on the sea ice underside (SIPL, sub-ice platelet layer). Simultaneously, we measured the background oceanic temperature, salinity, currents and turbulence structure. At the camp location the total water depth was 536 m, with the uppermost 50 m of the water column being in-situ super-cooled. Tidal flow speeds had an amplitude of around 0.1 m s-1 with dissipation rates in the under-ice boundary layer measured to be up to e=10-6 W kg-1. Acoustic sampling (200 kHz) identified backscatter from large, individually identifiable suspended crystals associated with crystal sizes larger than normally described as frazil. Crystal sizes in the SIPL were also measured. RELATED PUBLICATION: https://doi.org/10.3389/fmars.2023.1103740 GET DATA: https://doi.org/10.17882/90432
-
Ocean–atmosphere–sea ice interactions are key to understanding the future of the Southern Ocean and the Antarctic continent. Regional coupled climate–sea ice–ocean models have been developed for several polar regions; however the conservation of heat and mass fluxes between coupled models is often overlooked due to computational difficulties. At regional scale, the non-conservation of water and energy can lead to model drift over multi-year model simulations. Here we present P-SKRIPS version 1, a new version of the SKRIPS coupled model setup for the Ross Sea region. Our development includes a full conservation of heat and mass fluxes transferred between the climate (PWRF) and sea ice–ocean (MITgcm) models. We examine open water, sea ice cover, and ice sheet interfaces. We show the evidence of the flux conservation in the results of a 1-month-long summer and 1-month-long winter test experiment. P-SKRIPS v.1 shows the implications of conserving heat flux over the Terra Nova Bay and Ross Sea polynyas in August 2016, eliminating the mismatch between total flux calculation in PWRF and MITgcm up to 922 W m−2. RELATED PUBLICATION: https://doi.org/10.5194/gmd-16-3355-2023 GET DATA: https://doi.org/10.5281/zenodo.7739059