 Metadata Catalogue
2022
Type of resources
Topics
Keywords
Contact for the resource
Provided by
Years
status
-
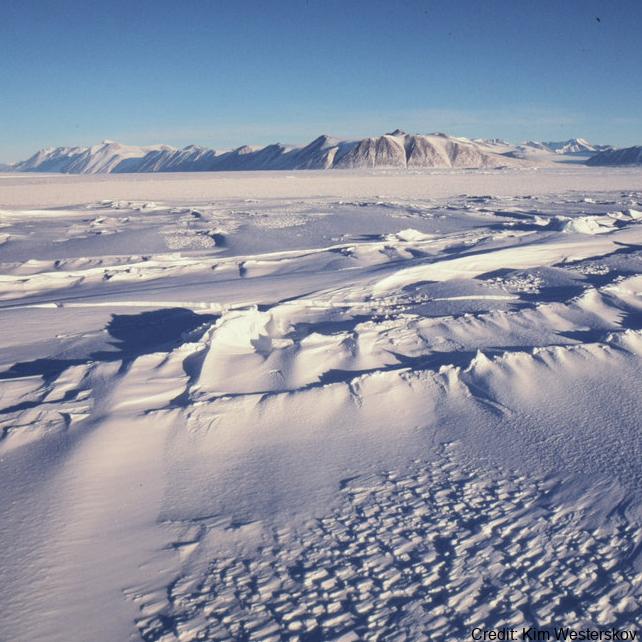
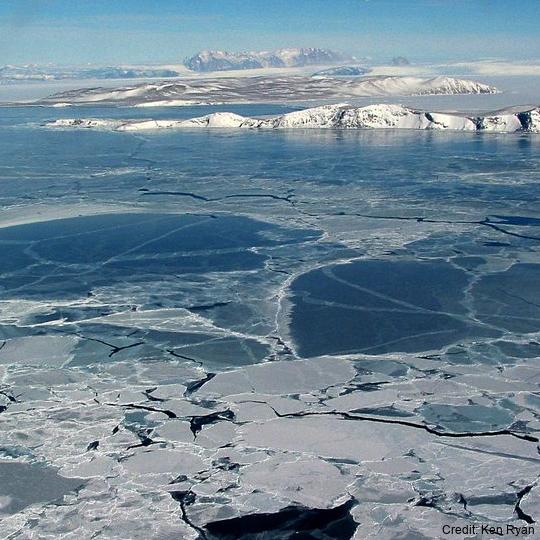
The data are approximately 800 km of airborne electromagnetic survey of coastal sea ice and sub-ice platelet layer (SIPL) thickness distributions in the western Ross Sea, Antarctica, from McMurdo Sound to Cape Adare. Data were collected between 8 and 13 November 2017, within 30 days of the maximum fast ice extent in this region. Approximately 700 km of the transect was over landfast sea ice that had been mechanically attached to the coast for at least 15 days. Most of the ice was first-year sea ice. Unsmoothed in-phase and quadrature components are presented at all locations. Data have been smoothed with an 100 point median filter, and in-phase and quadrature smoothed data are also presented at all locations. Beneath level ice it is possible to identify the thickness of an SIPL and a filter is described (Langhorne et al) to identify level ice. Level ice in-phase, quadrature and SIPL thickness, derived from these, are presented at locations of level ice. For rough ice, the in-phase component is considered the best measure of sea ice thickness. For level ice where there is the possibility of an SIPL, then the quadrature component is considered the best measure of ice thickness, along with SIPL thickness. All data are in meters.
-
This data publication contains biostratigraphic age events for the CIROS-1 drill core, updated age ranges for a suite of samples from the McMurdo erratics sample collection, age-depth tie points for CIROS-1, CRP-2/2A, DSDP 270, DSDP 274, ANDRILL 2A and ANDRILL 1B, and glycerol dialkyl glycerol tetraethers (GDGTs) abundances and indices for samples from the McMurdo erratics, CIROS-1, CRP-2/2A, DSDP 270, DSDP 274, ANDRILL 2A, and ANDRILL 1B. All sample sites are in the Ross Sea region of Antarctica. The McMurdo erratics are glacial erratics collected in the McMurdo Sound region between 1991 and 1996 (Harwood and Levy, 2000). The CIROS-1 drill core was collected from McMurdo sound in 1986 with samples spanning the upper Eocene to lower Miocene. CRP-2/2A drill core was collected in 1999 from offshore Victoria Land with samples for this study from the upper Oligocene-lower Miocene. DSDP Site 270 was recovered from the Eastern Basin of the central Ross Sea in 1973, with samples spanning the upper Oligocene-lower Miocene. DSDP Site 274 was drilled on the lower continental rise in the northwestern Ross Sea in 1973, and samples for this study have been taken from the middle Miocene sections of the drill core. The ANDRILL-2A core was recovered in 2007 from Southern McMurdo Sound, samples span the lower Miocene to middle Miocene and data was originally published in Levy et al. (2016). The ANDRILL-IB core was drilled from the McMurdo Ice Shelf in 2006, samples are compiled from the Plio-Pleistocene section of the core and were originally published in McKay et al. (2012). Biostratigraphic age events are described for CIROS-1, expanding on and updating previously published age models and biostratigraphic ranges. Ages are also revised for the McMurdo erratics by updating the ages of the biostratigraphic markers described by (Harwood and Levy (2000) to more recently published age ranges. Age models for the sample sites are developed using published age datums and the Bayesian age-depth modelling functionality in the R package Bchron (Haslett and Parnell, 2008) to ensure a consistent approach for assigning ages to core depths between datums. GDGT abundances and indices for Ross Sea sites are presented to reconstruct ocean temperatures over the Cenozoic era. Detailed methodology for the processing and analysis of samples for GDGTs is described in the methods section of supplement paper.
-

Plot data Mc Nemar: To enable comparisons with the 1961 and 2004 survey results, the Lambert Conformal Conic projection from the 2004 survey was used to precisely georeference and trim the RGB image across a 1-m2 grid, generating a total of 3,458 1-m2 grid cells. For each grid cell moss, lichen, or algae/cyanobacteria cover was extracted as one of the four cover classes: Heavy (>40%), Patchy (10–40%), Scattered (less than 10%), and None (0%) for the survey years 1962, 2004 and 2018. Ground truthing: To test the overall accuracy of cover classifications and ensure consistency with 2004 survey methodologies, a ground-truthing approach was performed. Photographs were taken of individual cells along eight transects, running west to east across the plot at 0.5, 1.5, 15.5, 16.5, 28.5, 29.5, 116.5 and 117.5 m distance from the NW corner. Each grid cell could be identified individually with an x/y coordinate in the centre and was surrounded by a rectangular frame parallel to the outer edge of the plot. A total of 174 photographs were taken and archived with Antarctica New Zealand. For each photographed grid cell, the presence of each functional group of vegetation and their cover class was assessed visually. Orthomosaic image: Aerial images were obtained using a DJI Matrice 600 Pro hex-rotor remotely piloted aircraft system equipped with a Canon EOS 5Ds camera (image size: 8688×5792 pixels, focal length: 50 mm, pixel size: 4.14 μm) on November 28, 2018. The flight altitude was 30 m above ground level, and a total of 10 ground-control points were included to provide accurate geo-referencing. An orthomosaic photo and accompanying DEM was generated with the acquired aerial images using Agisoft PhotoScan (now known as Metashape by Agisoft LLC, https://www.agisoft.com/) RELATED PUBLICATION: https://doi.org/10.1029/2022EF002823 GET DATA: https://doi.org/10.7488/ds/3417
-
The data are approximately 800 km of airborne electromagnetic survey of coastal sea ice and sub-ice platelet layer (SIPL) thickness distributions in the western Ross Sea, Antarctica, from McMurdo Sound to Cape Adare. Data were collected between 8 and 13 November 2017, within 30 days of the maximum fast ice extent in this region. Approximately 700 km of the transect was over landfast sea ice that had been mechanically attached to the coast for at least 15 days. Most of the ice was first-year sea ice. Unsmoothed in-phase and quadrature components are presented at all locations. Data have been smoothed with an 100 point median filter, and in-phase and quadrature smoothed data are also presented at all locations. Beneath level ice it is possible to identify the thickness of an SIPL and a filter is described (Langhorne et al) to identify level ice. Level ice in-phase, quadrature and SIPL thickness, derived from these, are presented at locations of level ice. For rough ice, the in-phase component is considered the best measure of sea ice thickness. For level ice where there is the possibility of an SIPL, then the quadrature component is considered the best measure of ice thickness, along with SIPL thickness. All data are in meters.
-
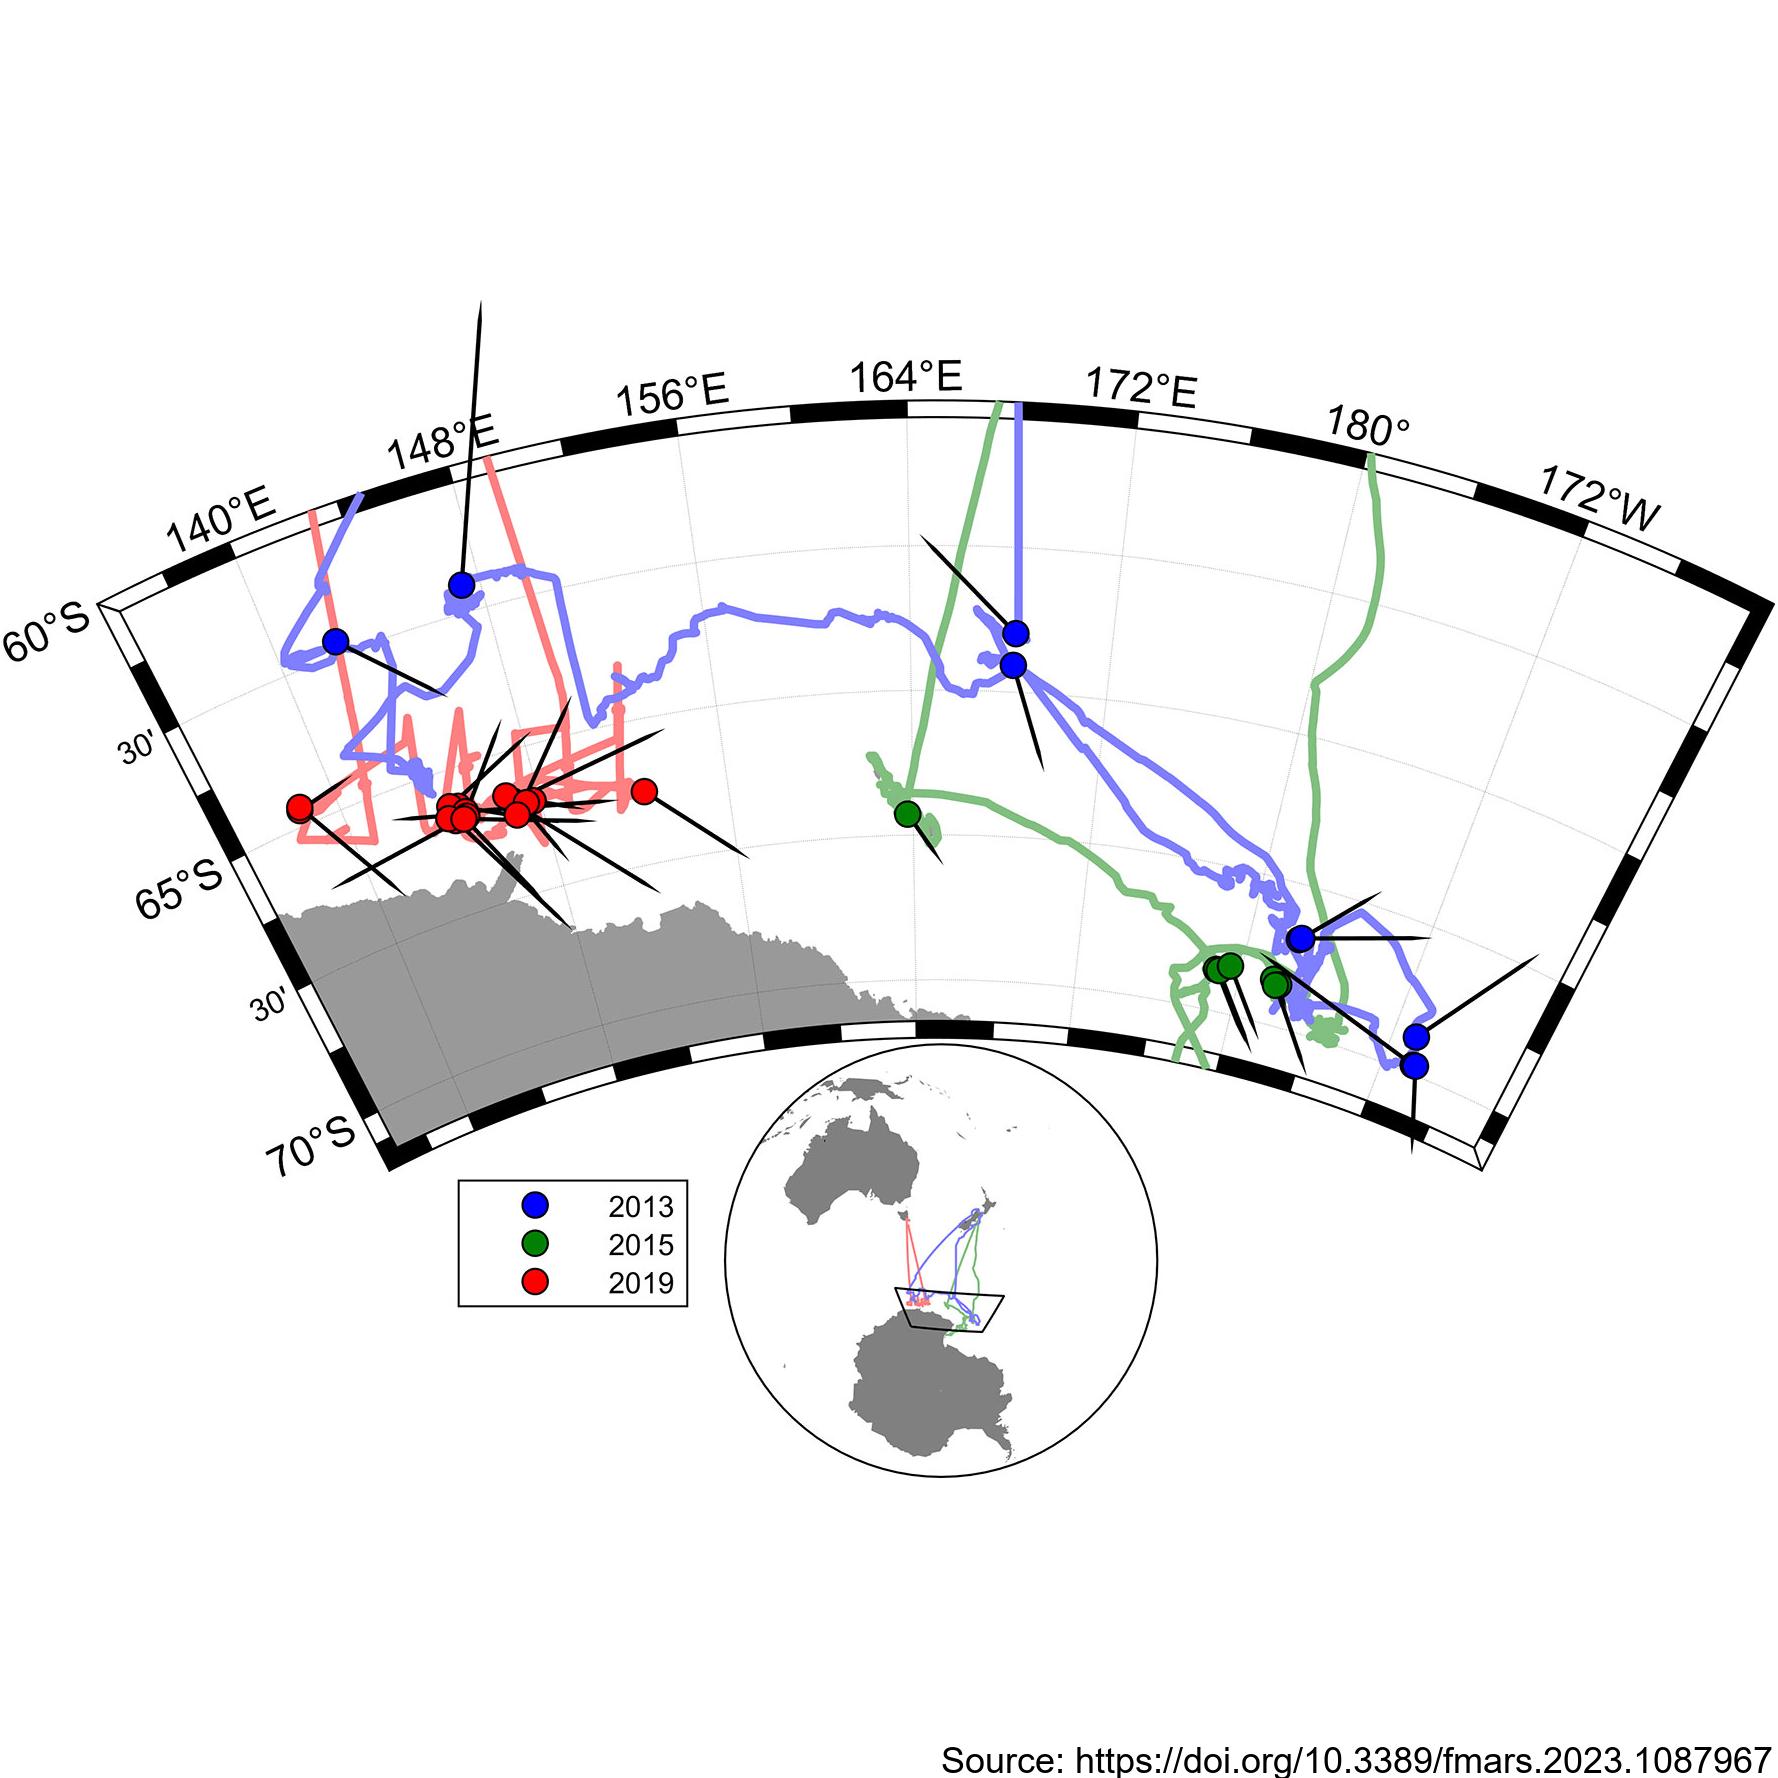
During the 2019 ENRICH Voyage of the CSIRO vessel, RV Investigator, a digital photogrammetric video tracking system was used to collect precise surfacing locations during encounters with mainly Antarctic blue whales, but also some fin whales. The photogrammetric video tracking system is a modern digital video version based on the same operating principle as the that described by Leaper and Gordon 2001, and enables determination of the range and bearing to tracked objects relative to the ship. Video tracking was conducted on 24 occasions for a total of 18 hours. Focal follows were aborted when it was no longer possible to follow the focal animal due to ice or when the presence of other animals meant it was no longer possible to be sure which was the focal animal. Calderan SV, Leaper R, Andrews-Goff V, Miller BS, Olson PA, Reyes MVR, Bell E and Double MC (2023) Surfacing rates, swim speeds, and patterns of movement of Antarctic blue whales. Front. Mar. Sci. 10:1087967. https://doi.org/10.3389/fmars.2023.1087967 GET DATA: https://doi.org/10.26179/tcbe-4h63
-
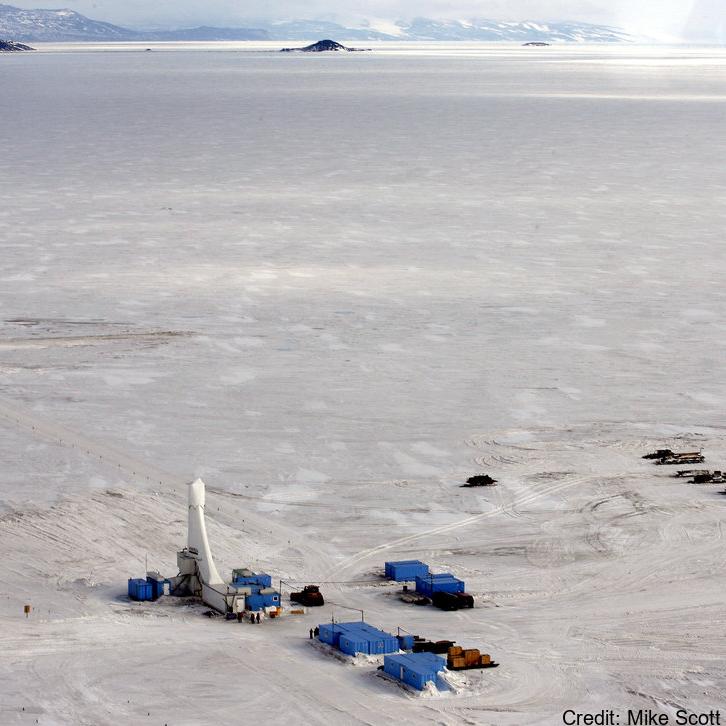
This work was primarily funded by the NASA-funded RISE-UP: Ross Ice Shelf & Europa Underwater Probe (PI Britney E. Schmidt) project. Field work at the KIS-1 site during the 2019-2020 season was completed through international collaboration between NASA, NSF/USAP, and Antarctica New Zealand, funded by the Aotearoa New Zealand Antarctic Science Platform (ANTA1801) Antarctic Ice Dynamics Project (ASP02101), and the NZARI-funded Aotearoa New Zealand Ross Ice Shelf Programme, “Vulnerability of the Ross Ice Shelf in a Warming World” (grant no. 2014-11). The data contained in this directory are merged and calibrated data files from three missions conducted with ROV Icefin through a borehole drilled through Ross Ice Shelf at KIS1 (-82.78410, -155.26267), near the Kamb Ice Stream grounding zone. Missions were conducted in 2019 on December 16th, 18th, and 21st (UTC). For questions or assistance working with the data please contact Britney Schmidt (britneys@cornell.edu) and Justin Lawrence (jdl287@cornell.edu). Related Publication: https://doi.org/10.1038/s41561-023-01129-y GET DATA: https://doi.org/10.15784/601625
-

In collaboration between the Korea Polar Research Institute and NIWA, an oceanographic mooring was deployed to the North of the Drygalski Ice Tongue (lat:-75.360767, lon:164.746467) on March 2020, and it was recovered on March 2022 (ANA12D research cruise). To monitor physical properties (Temperature, Salinity, Current) of ocean water in the north of the Drygalski Ice Tongue. GET DATA: https://kpdc.kopri.re.kr/search/3e3f6f5f-4989-4263-b351-d8df3b1e0471