 Metadata Catalogue
asNeeded
Type of resources
Topics
Keywords
Contact for the resource
Provided by
Years
Update frequencies
status
-

Climate data have been collected at Scott Base continuously since 1957 and more recently from Arrival Heights and is one of the longest continuous climate records in Antarctica. Climate parameters measured include: wind speed and direction, air temperature, relative humidity, barometric pressure, and global, diffuse and direct solar radiation. Climate data are collected on a daily basis from both sites. At Scott Base, this takes two forms: a standard daily observation at 0900 NZDT, and continuous data collection at 10 minute and hourly intervals using a CR10X data logger. The initial record of the 0900 daily observations began on 1 March 1957 with air temperature, air pressure, wind speed and direction, and global solar radiation being measured with standard instrumentation (wind measurements since 1972). This record constitutes the reference record. In January 1997 an electronic weather station (EWS) was added to collect and archive 10 minute and hourly data. The daily manual observations continued so as to provide a continuous reference and daily record. Historically, Arrival Heights only had a wind recorder (since January 1984). A data logger was installed in January 1999 and measured air temperature, relative humidity and global solar radiation using a secondary network sensor, as well as wind speed and direction. A barometric pressure sensor was installed in 2001. A standard 10m mast was installed and all sensors were moved to the new Arrival Heights laboratory in 2007. 10-minute and hourly data are recorded. Data are retrieved and archived from both automatic stations daily, as well as manual observations from Scott Base and available on New Zealand's national climate database. From February 2019, mercury theremometers and barometers were removed from Scott Base and Arrival Heights. Where applicable, these were replaced with electronic instruments. A weighing precipitation gauge was also installed in February 2019 for the measurement of solid precipitation at Scott Base. GET DATA: https://cliflo.niwa.co.nz/
-
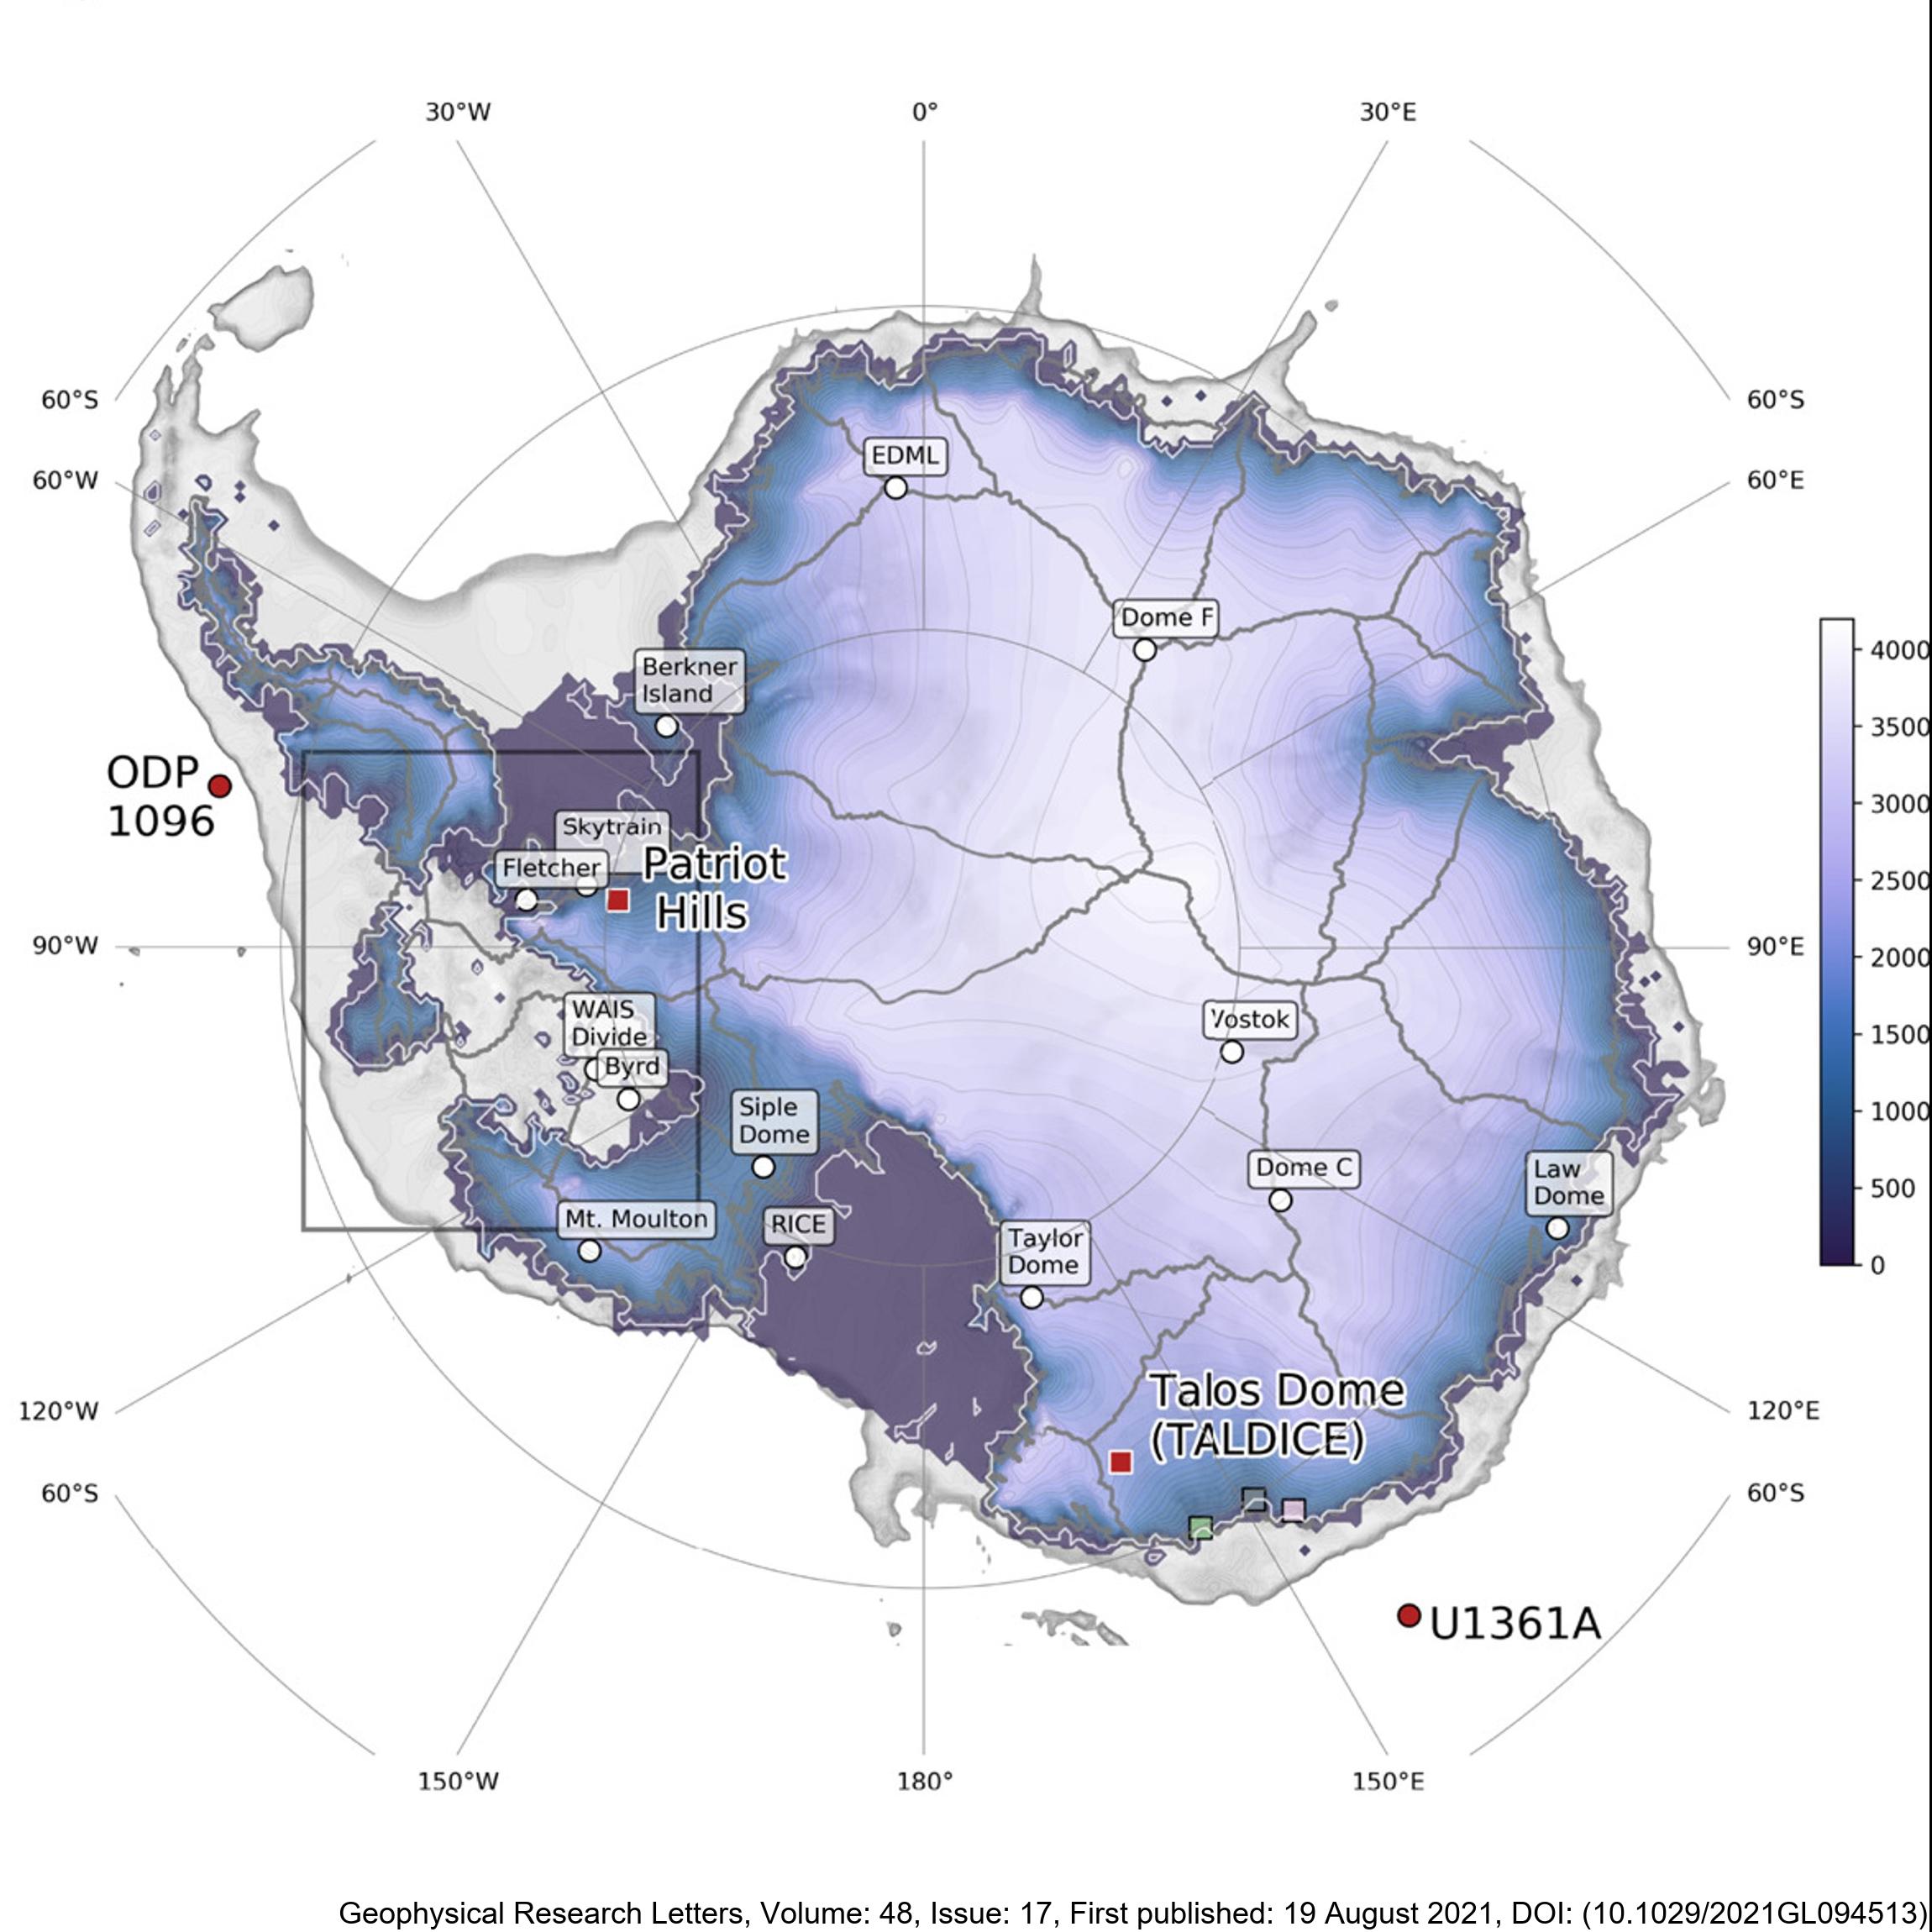
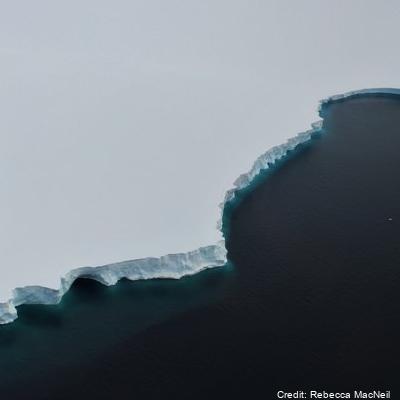
Here, we present new, transient, GCM-forced ice-sheet simulations validated against proxy reconstructions. This is the first time such an evaluation has been attempted. Our empirically constrained simulations indicate that the AIS contributed 4 m to global mean sea level by 126 ka BP, with ice lost primarily from the Amundsen, but not Ross or Weddell Sea, sectors. We resolve the conflict between previous work and show that the AIS thinned in the Wilkes Subglacial Basin but did not retreat. We also find that the West AIS may be predisposed to future collapse even in the absence of further environmental change, consistent with previous studies. There are two files, for Termination 1 ('T1') and Termination 2 ('T2'). They contain spatial fields for ice thickness, ice surface elevation, bedrock elevation, surface and basal velocity, and mask. The T1 outputs are every 500 years, whereas the T2 outputs are every 100 years. The spatial resolution of both is 20 km. Sea-level-equivalent mass loss can be calculated from these outputs, but is also provided here in a text file for convenience. RELATED PUBLICATION: Golledge, N.R., Clark, P.U., He, F., et al. (2021). Retreat of the Antarctic Ice Sheet During the Last Interglaciation and Implications for Future Change. Geophysical Research Letters, 48(17). https://doi.org/10.1029/2021GL094513 GET DATA: https://doi.org/10.17605/OSF.IO/GZB3H
-
Aerial reconnaissance and photography are used in the Ross Sea sector of Antarctica to determine the breeding locations of Adélie penguins and to count the numbers of nests occupied during the early incubation period. From 1981 to present (two-year embargo), all islands and sea coasts between 158°E and 175°E have been searched, and 11 previously unreported breeding colonies discovered. The aim is to census Adélie (Pygoscelis adeliae) populations to provide basic data against which future population levels can be compared in order to monitor environmental change of the Antarctic Ocean ecosystem, both natural and man-induced. GET DATA: https://datastore.landcareresearch.co.nz/en_AU/dataset/adelie-penguin-census-data
-
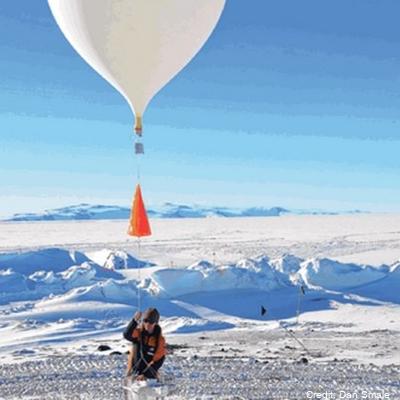
Altitude profile measurements of water vapour, ozone and aerosols using balloon packages flown through the troposphere into the stratosphere as part of the Ross Island GRUAN site activities. Maximum altitude recorded was 29 km. This project is a collaboration between the National Institute of Water and Atmospheric Research (NIWA) and NOAA. Timeline: - November 2022: 2 flights - February 2023: 1 flight - October 2023: 3 flights Data are held internally at NIWA and NOAA, and will be stored in the GRUAN database (https://www.gruan.org/data) GET_DATA: https://www.gruan.org/data
-
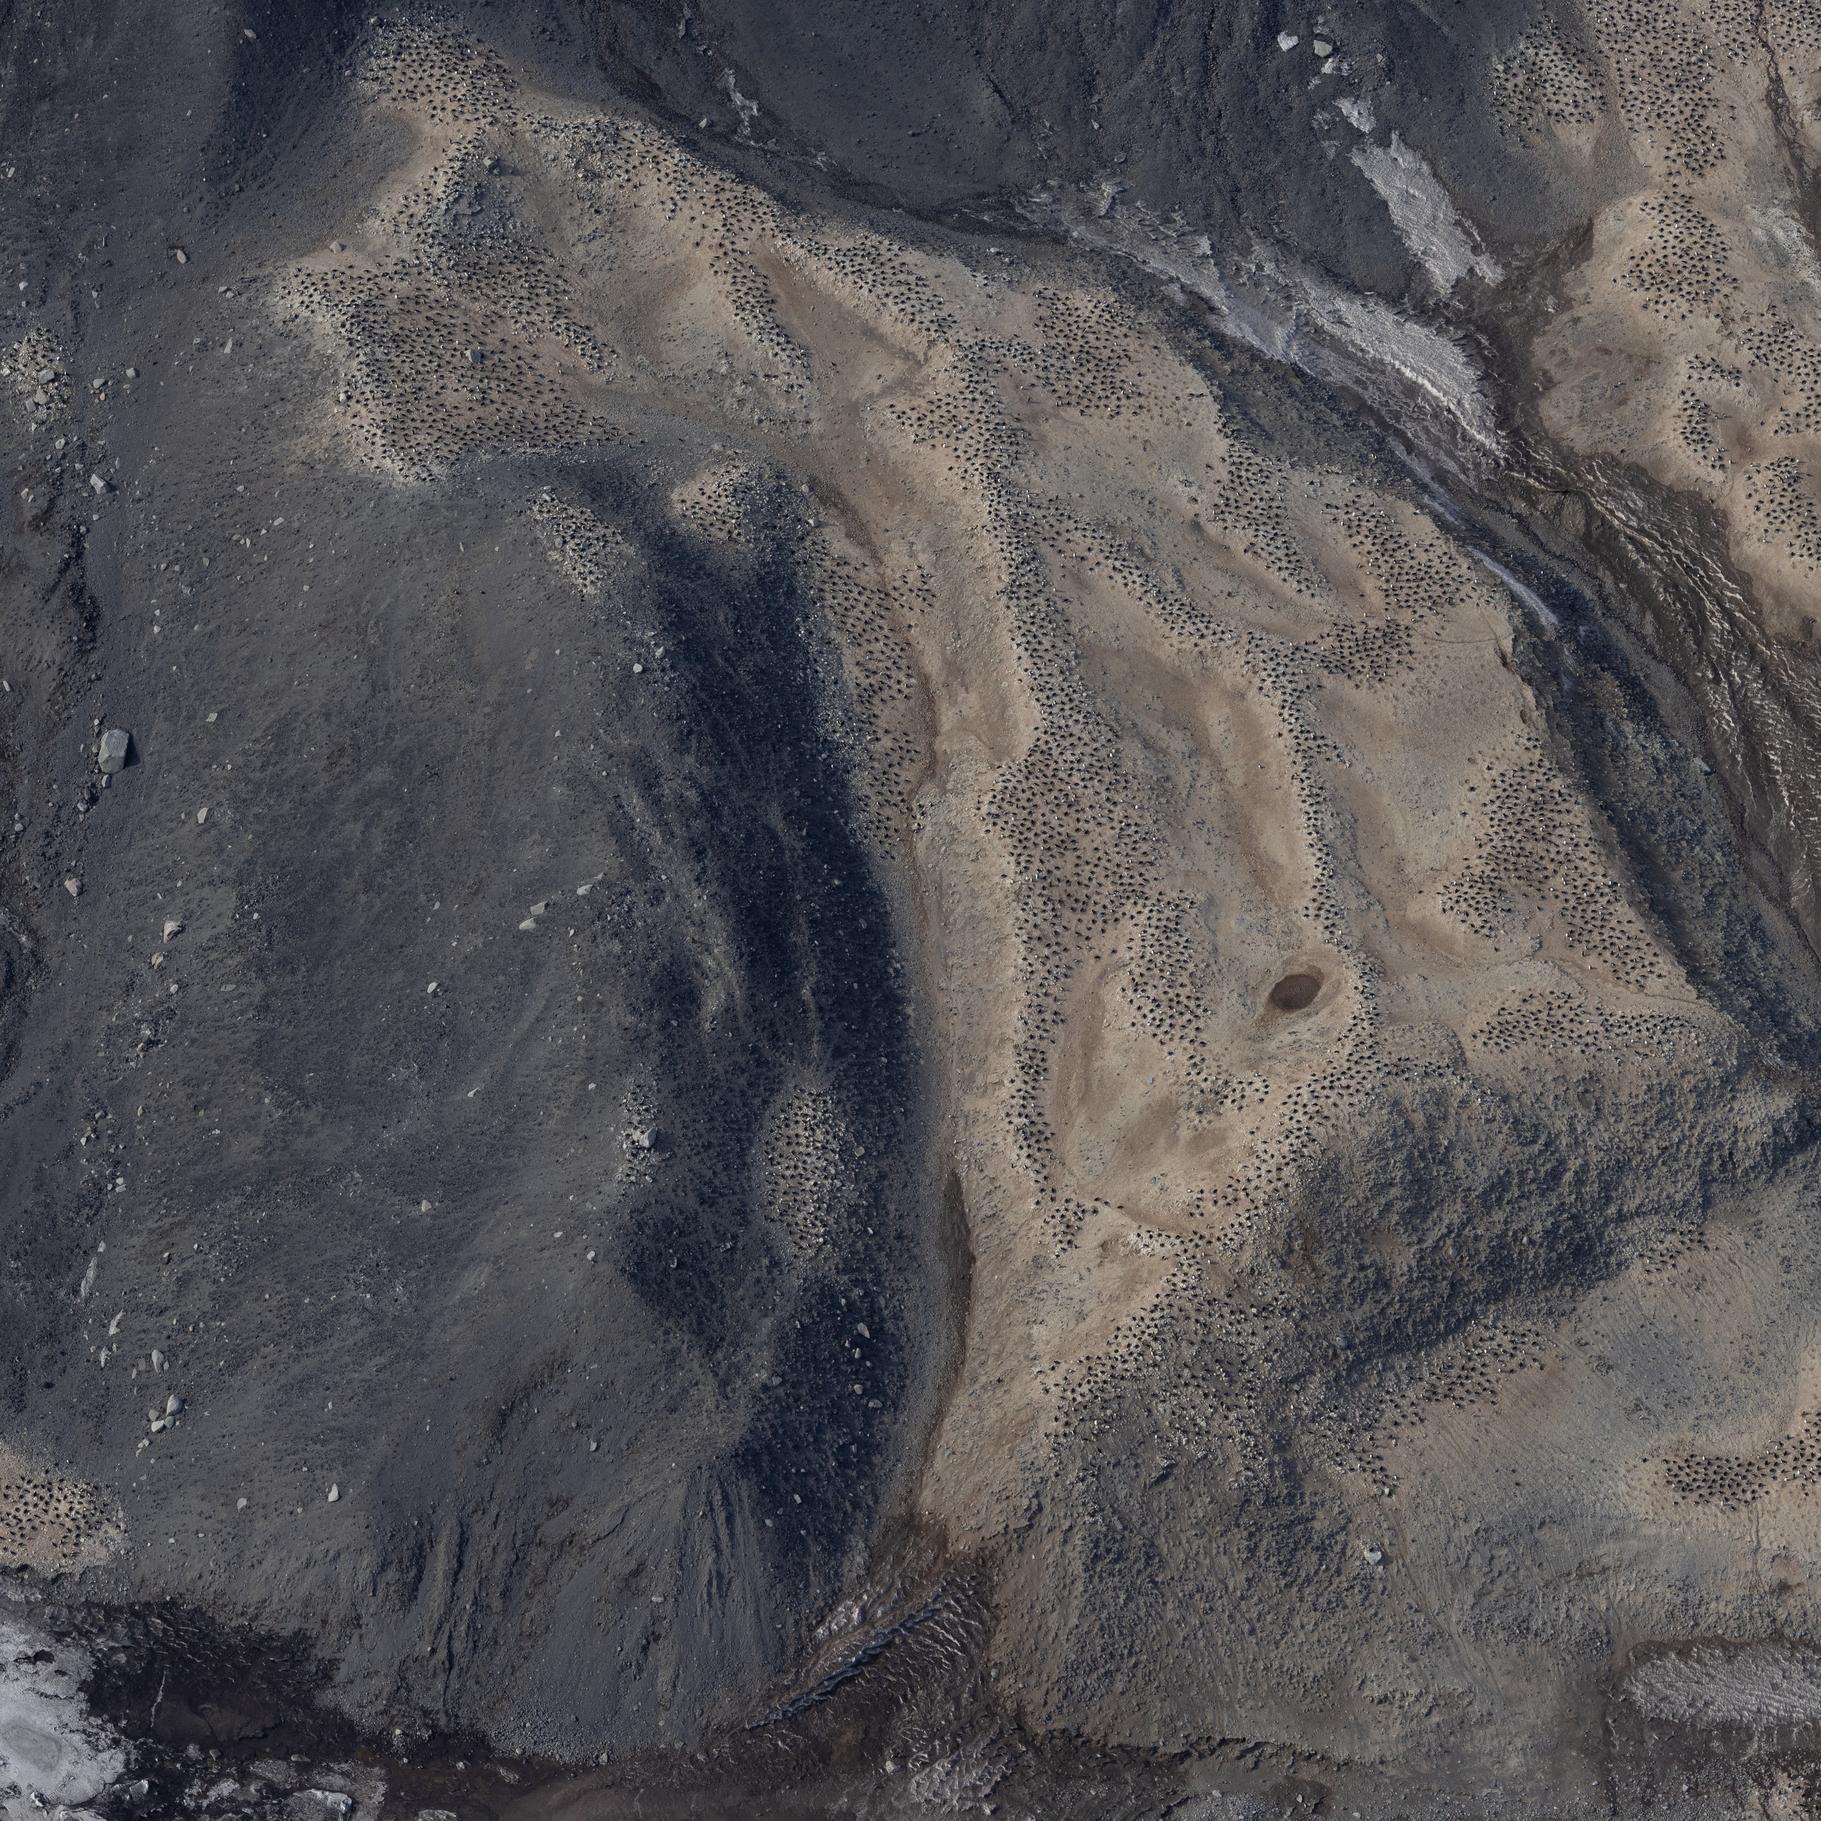
Raw images (over approximately 20.000 unique images) collected during the Adelie Penguin Census across 30+ colonies since 1981 (see associated metadata resource for list full list of colonies). Photographs were taken using a black and white film camera from 1981 to 2004 (inclusive) and 2008. Images are available in .tif fomrat. Images are digital from 2005 onwards (except 2008). Raw images are available in cr2/cr3 formats, and processed images are available across tif and jpg formats. High resolution scanning was initiated in 2011 to scan all the negatives in the collection. There are approximately 10,000 negatives in the collection. Images are taken from helicopter at between 2000-2500 feet. All images collected during the 2324 season are georeferenced with latitude and longitude positions in decimal degrees (WGS 84). Camera Settings: ISO = 400 Shutter speed = greater than 1/1000 Focus = manual, pre-focus to 800m Lens = 135mm with UV filter Aperture/ Exposure = F8 (or up to F11) Image Size = Full size White Balance Setting = Daylight Captures per minute = ~80 GET DATA: m.meredyth-young@antarcticanz.govt.nz
-
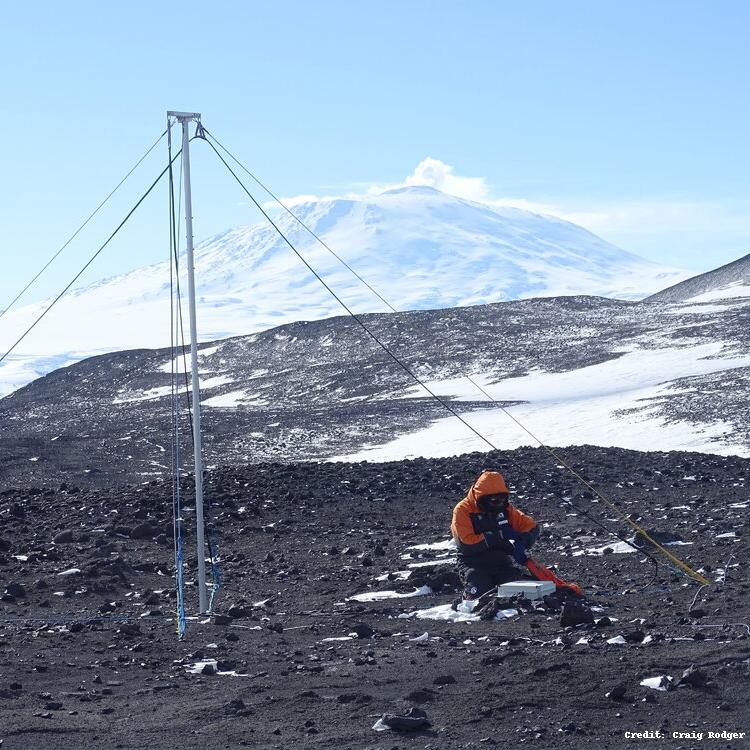
The WWLLN Very Low Frequency (VLF) Radio Sensor was installed at Scott Base in November 2015 by Dr. James Brundell and Ms. Emma Douma as part of Antarctica New Zealand Event K060-1516-A. The sensor measures the electric field in the Very Low Frequency radio range (~500 Hz-50 kHz) and passes it to a PC which processes the data for the experiments. The antenna is located behind the Hatherton lab. It was installed due to increasing manmade electromagnetic noise levels in the "quiet zone" at Arrival Heights. The observations from this antenna are now the primary WWLLN feed from Ross Island, the Arrival Height's magnetic field antenna is now a backup. WWLLN, uses the VLF feed but processes it to detect the radio-wave pulses from lightning. WWLLN observations are sent to a central processing computer to determine the time and location of lightning pulses all over the globe. The World Wide Lightning Location Network (WWLLN) is an experimental Very Low Frequency (VLF) network of sensors being developed through collaborations with research institutions across the globe. The network exploits the considerable electromagnetic power radiated by lightning as "sferics" present in the VLF band. By combining radio-pulse observations from at least 5 stations, the WWLLN central processing computers can determine the location of the original lightning discharge. As the radio-pulse observations are immediately sent back across the internet to the central processing computers locations are generated within ~10 s of the discharge, and thus near real time. There are currently about 70 active VLF receiving stations operating in the VLF World-Wide Lightning Location Network, including the Scott Base measurements. WWLLN observations are continuously transmitted to one of the WWLLN primary servers, in this case flash.ess.washington.edu at the University of Washington, Seattle, USA. GET DATA: https://space.physics.otago.ac.nz/aarddvark/
-
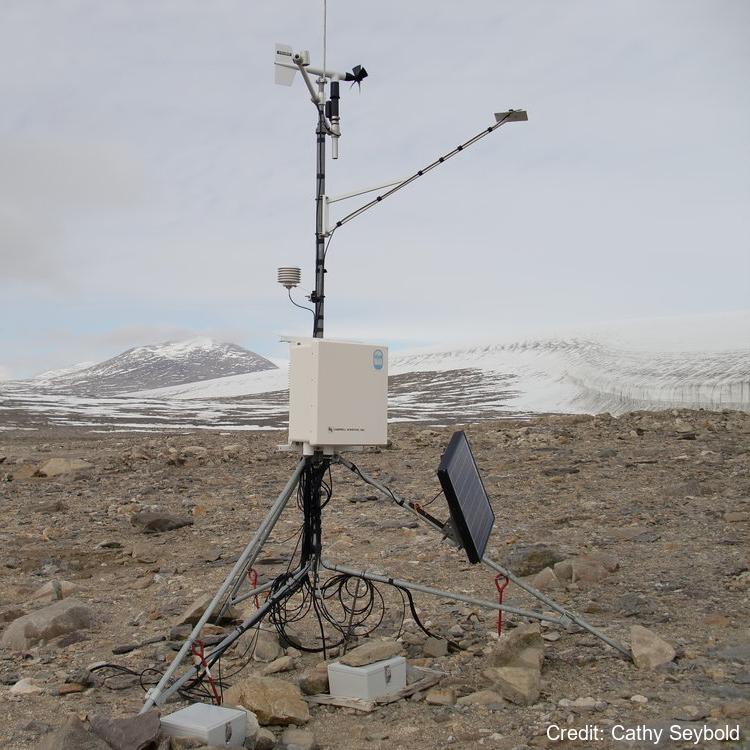
There are nine soil climate stations located in the McMurdo Sound region of Antarctica that were established starting in 1999 through 2011. Four of the stations are in the Dry Valleys and four are located along the coast. The ninth station is located on Mt. Fleming near the polar plateau. Each climate station measures atmospheric parameters (air temperature, relative humidity, wind speed and direction, and solar radiation) and soil parameters (soil moisture and temperature) that extend from the active layer (seasonally thawed layer) into the permafrost. Recorded measurements are made on an hourly basis. At each climate station the soils have been sampled and characterized at the Kellogg Soil Survey Laboratory. There are two borehole stations at Bull Pass and Marble Point which measure ground temperature and are used to study permafrost temperatures and active-layer thermal regimes to a depth of 30m. Further station and borehole details including the instruments' specification, maintenance, and measured variables are described in each site's data "_description" folder. GET DATA: https://www.nrcs.usda.gov/resources/data-and-reports/soil-climate-research-stations
-
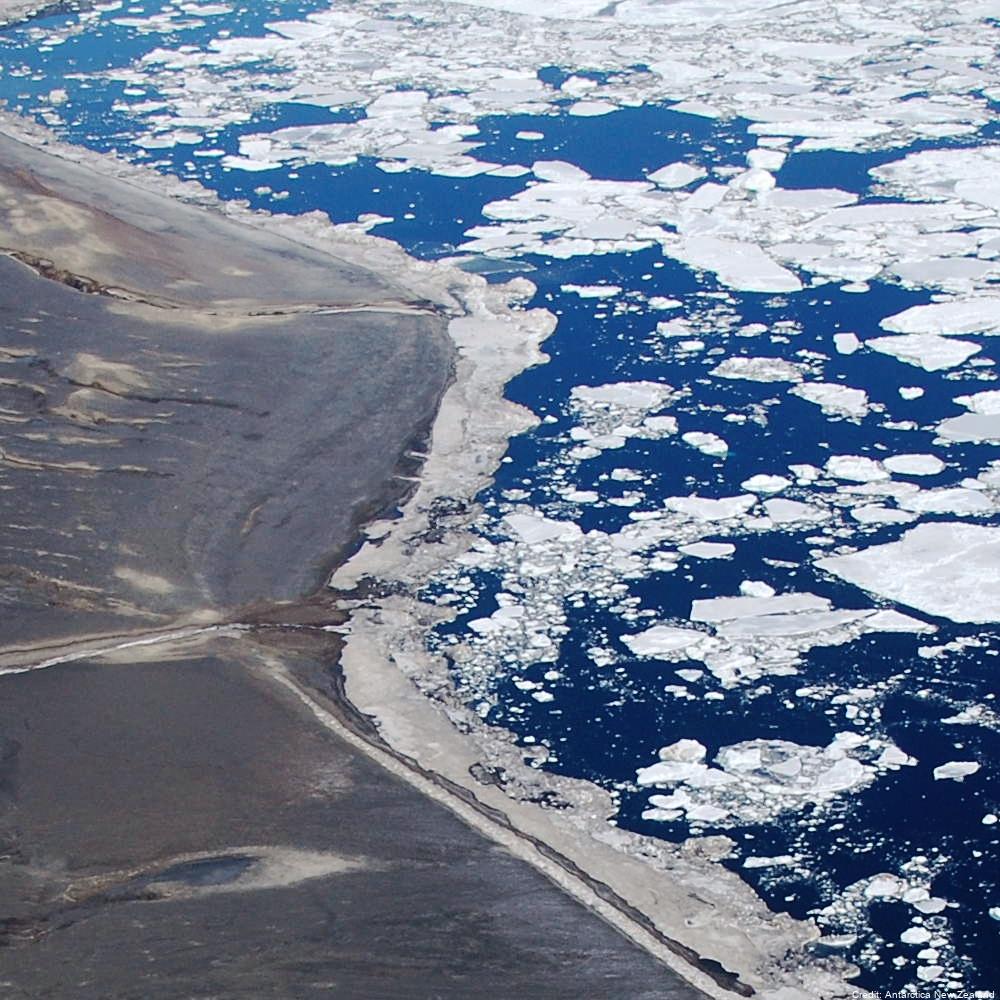
A tide gauge was installed in November 1990 and has been in near continuous operation since. A 10 minute average of water depth was recorded each hour with hourly averages of wind speed and direction, air temperature and solar radiation. From 2000 the recording frequency was increased from every hour to every 10 minutes. From 2003 data is read every 10 seconds and an average value (from 60 readings) is calculated every 5 minutes and recorded. Barometric pressure was measured as well, starting in 2003, with six barometric pressure readings made between 2 and 3 minutes in the 5-minute interval and averaged and recorded with the tide value. Each year the rise and fall of the sea ice is observed over a 2 - 3 day period during a spring tide using GPS. These measurements are related to a tide gauge bench mark and the sea surface to enable the reliability of the tide gauge to be checked. The tide gauge data is archived by Land Information New Zealand. GET DATA: https://sealevel-data.linz.govt.nz/index.html?tidegauge=ROBT
-
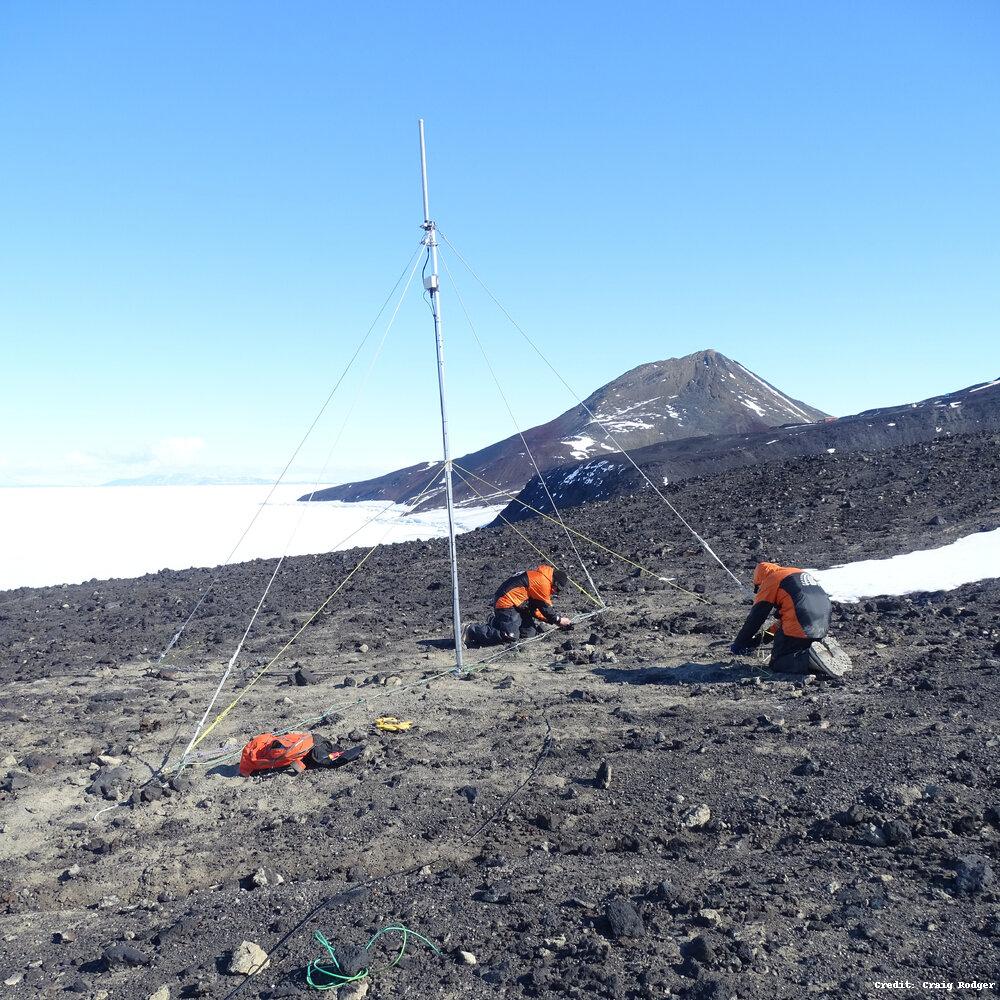
The AARDDVARK/WWLLN Very Low Frequency (VLF) Radio Sensor was installed at Arrival Heights from 10-15 December 2008 by Dr Craig J. Rodger and Dr. James Brundell as part of Antarctica New Zealand Event K069a. The sensor measures the magnetic field in the Very Low Frequency radio range (~500 Hz-50 kHz), and passes it to a PC which processes the data for the experiments. The primary experiment is the AARDDVARK observations. The secondary experiment, WWLLN, uses exactly the same VLF feed but processes it to detect the radio-wave pulses from lightning. WWLLN observations are sent to a central processing computer to determine the time and location of lightning pulses all over the globe. The World Wide Lightning Location Network (WWLLN) is an experimental Very Low Frequency (VLF) network of sensors being developed through collaborations with research institutions across the globe. The network exploits the considerable electromagnetic power radiated by lightning as "sferics" present in the VLF band. By combining radio-pulse observations from at least 5 stations, the WWLLN central processing computers can determine the location of the original lightning discharge. As the radio-pulse observations are immediately sent back across the internet to the central processing computers locations are generated within ~10 s of the discharge, and thus near real time. There are currently about 70 active VLF receiving stations operating in the VLF World-Wide Lightning Location Network, including the "Scott Base" measurements made at Arrival Heights or near the Hatherton Lab (depending on noise levels). WWLLN observations are continuously transmitted to one of the WWLLN primary servers, in this case flash.ess.washington.edu at the University of Washington, Seattle, USA. Two near-orthogonal magnetic field loops measuring VLF electromagnetic waves. The centre of the antenna is at 77° 49.790' S, 166° 39.438' E, based on a GPS measurement with 1 m accuracy. Logging is undertaken with standard WWLLN software, with GPS timing. GET DATA: https://wwlln.net/
-
This metadata record represents environmental DNA sequence data and metadata barcode file. Seawater and sponge eDNA metabarcoding sampling was conducted at seven coastal locations (Cape Barne, Cape Evans, Cziko Seamount, Granite Harbor Middle, Granite Harbor South, and Turtle Rock) in the Ross Sea to assess spatial eukaryote biodiversity patterns and investigate eDNA signal differences between both substrates. Five replicate 500 mL water samples were collected at each of seven locations within 2 m of the ocean floor using a Niskin bottle. At the same time, five sponge specimens were collected by ROV at a depth range of 18–30 m from three out of the seven locations, thereby enabling sponge and near-bottom water eDNA signal comparison. Further details and laboratory procedures can be found in https://doi.org/10.1002/edn3.500 GET DATA: https://figshare.com/projects/Unveiling_the_Hidden_Diversity_of_Marine_Eukaryotes_in_the_Ross_Sea_A_Comparative_Analysis_of_Seawater_and_Sponge_eDNA_Surveys/186127