 Metadata Catalogue
annually
Type of resources
Topics
Keywords
Contact for the resource
Provided by
Years
Update frequencies
status
-
Measurements of chlorine monoxide (ClO) made with a Microwave Chlorine Monoxide Millimeter Wave Spectrometer (ground-based). The instrument (ClOe1) was established in January of 1996 at Scott Base and decommissioned in October 2023. A replacement radiometer (ClOe4) was installed at Scott Base in February 2023 (an overlap in the data for timeseries continuity purposes). These data are produced in collaboration with State University of New York (SUNY) Stoney Brook and Naval Research Laboratory (NRL). “Raw” data are times and recorded microwave emission spectra. “Derived” data are column amounts and vertical profile information of chlorine monoxide (ClO). The instrument has acquired the nickname "CloeTechnique" for vertical profile information uses "optimal estimation" to extract information from pressure broadening of ClO emission line. Significant failure in early 2018 only fixed in November 2018. No data in the July - October 2018 period. Data is held at NRL and in the NDACC database. Data are available as monthly .ndm files, and additional metadata are available in the header. Instrument timeline: - ClOe1 1996-2023 - ClOe4 2023 – present GET DATA: https://www-air.larc.nasa.gov/missions/ndacc/data.html?station=scott.base#
-
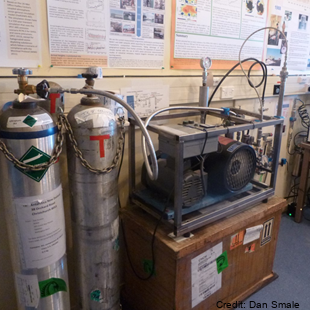
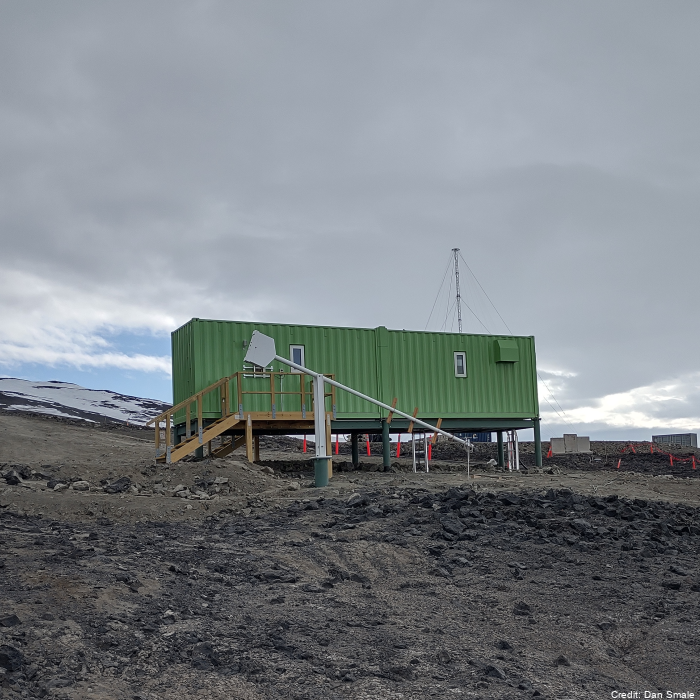
Gas samples (CO2, CH4, CO, N2O, 13CO2, 14CH4, 13CO, C18O, 14CO) are collected from an inlet atop of a mast 5 metres above ground level in North sector wind conditions. Flasks and cylinders are analysed back at NIWA Greta point Gaslab. The sampling was established in November 1989. Samples are only taken when wind is from the Northerly sector and above 5kts. High pressure cylinders: ~1600psi in 30 litre cylinders and low-pressure flask samples taken (~5 litres, 25 psi in 2 litre flask). Air samples in the Cylinders & Flasks shipped to New Zealand regularly. Analysis performed at NIWA's GASLAB located at Greta Point Wellington. Analysis by Gas chromatography (GC) and isotope ratio mass spectrometry (IRMS). A semi-automated flask sampling system was installed in February 2017, allowing extra flask samples with minimal operator intervention. GET DATA: Contact Gordon Brailsford (g.brailsford@niwa.co.nz)
-
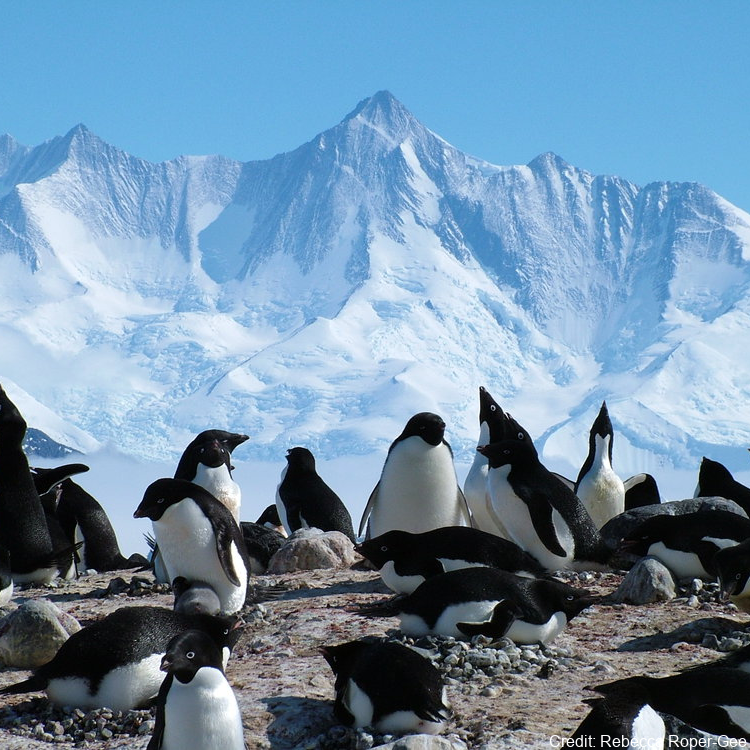
Polar regions are experiencing some of the most dramatic effects of climate change resulting in large-scale changes in sea ice cover. Despite this, there are relatively few long-term studies on polar species that evaluate the full scope of these effects. Over the last two decades, this team has conducted globally unique demographic studies of Adélie penguins in the Ross Sea, Antarctica, to explore several potential mechanisms for population change. This five-year project will use penguin-borne sensors to evaluate foraging conditions and behavior and environmental conditions on early life stages of Adélie penguins. Results will help to better understand population dynamics and how populations might respond to future environmental change. To promote STEM literacy, education and public outreach efforts will include multiple activities. The PenguinCam and PenguinScience.com website (impacts of >1 million hits per month and use by >300 classrooms/~10,000 students) will be continued. Each field season will also have ‘Live From the Penguins’ Skype calls to classes (~120/season). Classroom-ready activities that are aligned with Next Generation Science Standards will be developed with media products and science journal papers translated to grade 5-8 literacy level. The project will also train early career scientists, postdoctoral scholars, graduate students and post-graduate interns. Finally, in partnership with an Environmental Leadership Program, the team will host 2-year Roger Arliner Young Conservation Fellow, which is a program designed to increase opportunities for recent college graduates of color to learn about, engage with, and enter the environmental conservation sector. Further details are provided at: Morandini, V., Dugger, K. M., Schmidt, A. E., Varsani, A., Lescroël, A., Ballard, G., Lyver, P. O., Barton, K., & Ainley, D. G. (2024). Sex-specific recruitment rates contribute to male-biased sex ratio in Adélie penguins. Ecology and Evolution, 14, e10859. https://doi.org/10.1002/ece3.10859 GET DATA: https://doi.org/10.15784/601444
-
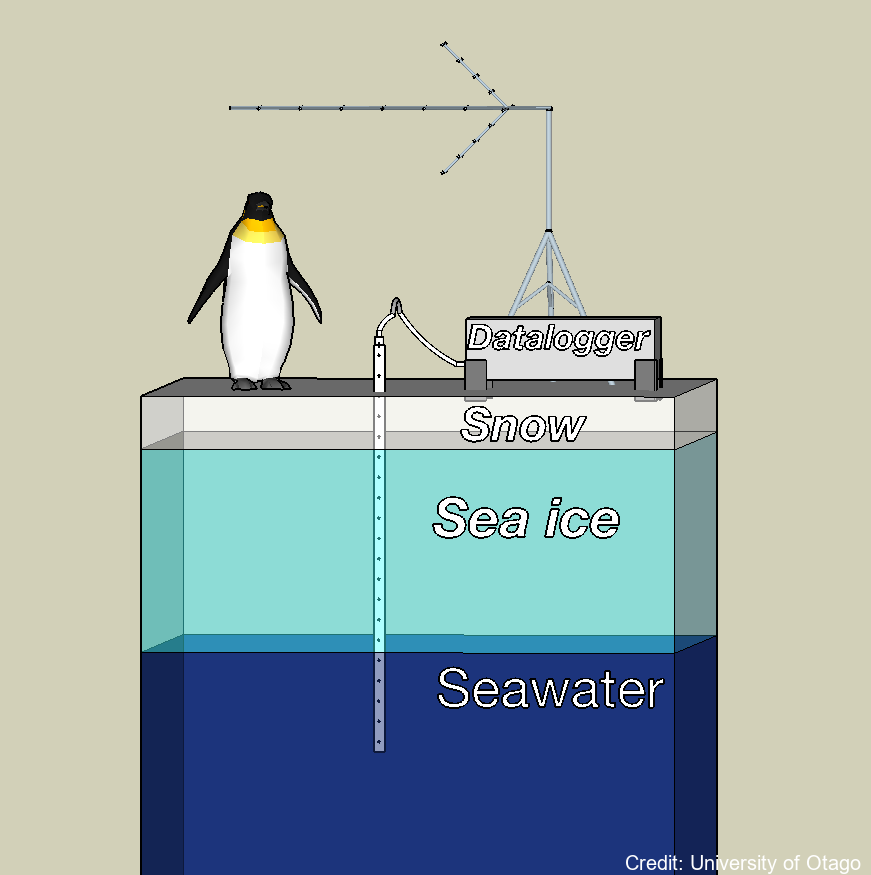
A semi-autonomous sea ice monitoring station (SIMS) was deployed to record ice temperature profiles and snow depths throughout the winter to late spring portion of the sea ice cover's growth season. These data were used to quantify the factors that govern the rate at which the sea ice grows. These factors include the local air temperature, vertical temperature gradient in the sea ice, the thickness of the overlying snow cover and the properties of the water column at the ice / water interface. The ice temperature profiles were recorded by a custom-built temperature probe designed by the University of Otago. The Otago thermistor probe consisted of twenty thermistors contained within a ~ 2.5 m long, 10 mm diameter stainless steel tube. The spacing of the thermistors in the probe was variable. This dataset provides information on the growth of the landfast sea ice and how much of this growth was due to heat loss to the atmosphere vs heat loss to the ocean. Locations: lat:-75.275700, lon:164.067300 (2022/23) Sea ice salinity and fabric cores were collected to understand sea ice growth rates, and indicate the different types of landfast sea ice (e.g. columnar versus incorporated platelet) and to determine their relative vertical positions with the sea ice cover. Sea ice, sub ice platelet layer, snow and freeboard measurements were used to validate ice thicknesses determined by analysing the sea ice temperature profiles collected by the SIMS. Snow depths were measured with a Campbell Scientific ultrasonic sensor (SR50). VIEW DATA: https://seaice.otago.ac.nz/ice-temp-graph/contour/
-
Measurements of partial and total column of several atmospheric trace gases (e.g.O3, HCl, N2O, CH4, HNO3, ClONO2, HCN, HF, OCS, CO, C2H6, CFC-11, CFC-12, COF2 + others). Measurements are made with Bruker Fourier transform spectrometers, using direct sunlight (or moonlight) at infrared wavelengths (700-10000cm-1). The Bruker FTS instruments have two liquid nitrogen cooled detectors (inSb & HgCdTe) and six optical filters. For 2014-2016 seasons, operated in parallel with Bruker 120M for intercomparison studies. Bruker 120M will then be retried. Bruker 125HR will replace it. Data are routinely analysed for HNO3, HCl, CH4, N2O, CO, ClONO2, HF, C2H6, HCN, and 10+ other species measurable. Information on other trace gases is contained in the spectra, not yet analysed/retrieved. “Raw” data are times and recorded interferograms which are Fourier transformed into spectra. “Derived” data are column amounts, and in some cases limited vertical profile information, of atmospheric trace gases. Technique for vertical profile information uses "optimal estimation" to extract information from pressure broadening of absorption lines: SFIT2/SFIT4. The original solar tracker was replaced with a newer tracker in December 2017, active tracking of sun now possible. A Bruker EM27-Sun operated for a summer season at AHTS, to access capability. Measurements of total column CO2, CH4 and CO. Data archived as part of the COCCON network. Instrument timeline: - Bomen DA2 FTS 1990-1994 (HNO3 and HCl only) - Bruker 120M: 1996-2016 - Bruker 125HR: 2015 – present - EM27-Sun: Campaign based low resolution instrument (CO2, CH4 and CO only). February 2016 and then November 2020 – February 2021 GET DATA: https://www-air.larc.nasa.gov/missions/ndacc/data.html?station=arrival.heights GET DATA (EM27-Sun): https://www.imk-asf.kit.edu/english/COCCON.php
-
Measurements of total column of ozone made with Dobson spectrophotometer that measures either direct or zenith scattered ultraviolet light. The instrument was established in September of 1989 at 77° 49.8'S, 166° 39.6'E. Additionally a Brewer spectrophotometer took total column ozone measurements at Scott from 1989 to 1996. From 1989 to 2006 the Dobson (ID 17) was operated in manual mode but had an electronic encoder and computer added in 2006 for recording measurements. The data acquisition system was upgraded in Febuerary 2015 at Lauder, NZ. It is now running the JMA automation system. The Dobson (instrument ID: D17) is shipped out for maintenance and intercomparison with regional standard Dobson in Melbourne approximately every 5 years. Data (for both Dobson and Brewer) is held internally by NIWA and in the NDACC database. Data is also archived in the ozone and UV data centre Toronto, “Raw” data are times and instrument settings for instrument readings. “Derived” data are column amounts of ozone. Time line: Dobson 1987 -present Brewer 1989-1996 GET DATA: https://www-air.larc.nasa.gov/missions/ndacc/data.html?station=arrival.heights#
-
Spectroscopic measurements of stratospheric gases Nitrogen Dioxide (NO2), Chlorine Dioxide (OCIO), Bromine Oxide (BrO) and Ozone (O3) using scattered sunlight. Airyx and Envimeas: A dual MAX-DOAS UV/visible wavelength diode array spectrometer is deployed to measure of ozone (O3), nitrogen dioxide (NO2), chlorine dioxide (OClO) and bromine oxide (BrO). The instrument is a similar instrument to that of EnviMeas, and produces overlapping datasets with ADAS-2. Fixed azimuth direction, same as the Antarctic Diode Array spectrometer. System 2 (ADAS-2). The data are currently being held internally by NIWA. “Raw” data are times and recorded spectra of scattered light for several viewing directions. “Derived” data are column amount of NO2, OClO, BrO and O3, which can be split into tropospheric and stratospheric parts. This technique is sometimes referred to as MAX-DOAS Multiple-Axis Dual Optical Absorption Spectrometry. This work is carried out in collaboration the University of Heidelberg. ADAS2, Envimeas and Airyx measurements: UV/visible Multi-Axis Differential Optical Absorption Spectroscopy (MAX-DOAS) diode array spectrometers making measurements of ozone (O3), nitrogen dioxide (NO2), chlorine dioxide (OClO) and bromine oxide (BrO). JY: A scanning grating UV/Vis monochromator taking measurements of total slant column of NO2 and Ozone using scattered zenith sunlight. ADAS: A CCD grating UV/Vis grating Acton spectrometer making measurements of total slant column NO2, BrO, OClO and ozone made using scattered light zenith sunlight. Pandora: Direct sun UV/Vis measurements of ozone and NO2. Campaign to test feasibility of long term deployment at Arrival Heights. Instrument timeline JY: 1982 -2023 ADAS: 1993 - 2017 ADAS2: 1998 - present Pandora: 2015 Aug – Oct. Airyx & Envimeas : 2018 – present O3, OCIO and BrO data are in the process of being archived - please contact Richard Querel for data access. NO2 data is available via the "GET DATA" link. GET DATA: https://www-air.larc.nasa.gov/missions/ndacc/data.html?station=arrival.heights
-
Measurements of boundary layer concentration of ozone are made with insitu instruments that samples air continuously at Arrival Heights, Antarctica and is part of the NOAA Global Monitoring Surface Ozone Network. Original measurements at Arrival Heights were made with a Dasibi Environmental Corp in situ analyser. This was replaced with a TEI-49c in situ analyser. The TEI-49c is owned by NOAA and operated by NIWA at Arrival Heights until October 2023. In October 2023 operation of the TEI was transferred to the USAP Arrival Heights laboratory along with operational responsibility (between NOAA and USAP). This data set contains continuous UV photometric data of surface level ozone collected at 6m above ground level. Data records consist of UTC time, date, and processed ozone mixing ratio (parts per billion). Data is collected from global locations and is provided in 1 minute and 1 hour averages. Data are archived at the NOAA National Climatic Data Center (NCDC), but are produced and available from NOAA Earth System Research Laboratory (ESRL). Instrument timeline: - Dasibi 1997-2003 - TEI49c 2003 – October 2023 - TEI49i November 2023 -present at USAP Arrival Heights laboratory GET DATA: https://gml.noaa.gov/aftp/data/ozwv/SurfaceOzone/ARH/