 Metadata Catalogue

Type of resources
Topics
Keywords
Contact for the resource
Provided by
Years
Update frequencies
status
-

In collaboration between Korea Polar Research Institute and NIWA, an oceanographic mooring was deployed to the south of the Drygalski Ice Tongue (lat:-75.488417, lon:163.174350) on 12 February 2017 as a part of the ANA07C research cruise, and it was recovered on 7 March 2018. To monitor physical properties (Temperature, Salinity, Current) of ocean water in the south of the Drygalski Ice Tongue. GET DATA: https://kpdc.kopri.re.kr/search/9245184f-b187-4c1e-ad6f-32ed1f9493c8
-

In collaboration between Korea Polar Research Institute and NIWA, an oceanographic mooring was deployed to the North of the Drygalski Ice Tongue (lat:-75.360767, lon:164.746467) on 9 February 2017 as a part of the ANA07C research cruise, and it was recovered on 5 March 2018. To monitor physical properties (Temperature, Salinity, Current) of ocean water in the north of the Drygalski Ice Tongue. GET DATA: https://kpdc.kopri.re.kr/search/c266365d-4846-4242-952b-75102a53110b
-
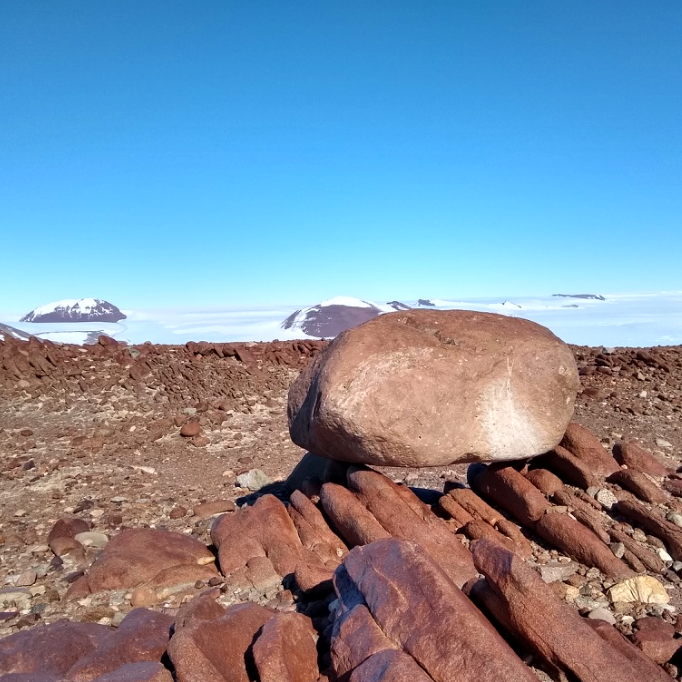
Cosmogenic surface exposure chronologies were used to quantitatively constrain past rates of ice thinning, and the absolute timing of ice discharge and thinning events. We sampled glacial erratics and bedrock from Byrd Glacier (LW1 Nunatak, LW2 Nunatak, Lonewolf Nuntataks, Tiger Nunatak, Mt. Tadpole). Samples were analysed for their exposure history, and all sites contained glacial erratics. In particular, the Lonewolf Nunataks sites, which is located along the margin of the East Antarctic Ice Sheet revealed a plethora of glacial cobbles. Details of laboratory procedures can be found in the related publication. RELATED PUBLICATION: https://doi.org/10.1002/esp.5701 GET DATA: https://version2.ice-d.org/antarctica/publication/1139/
-
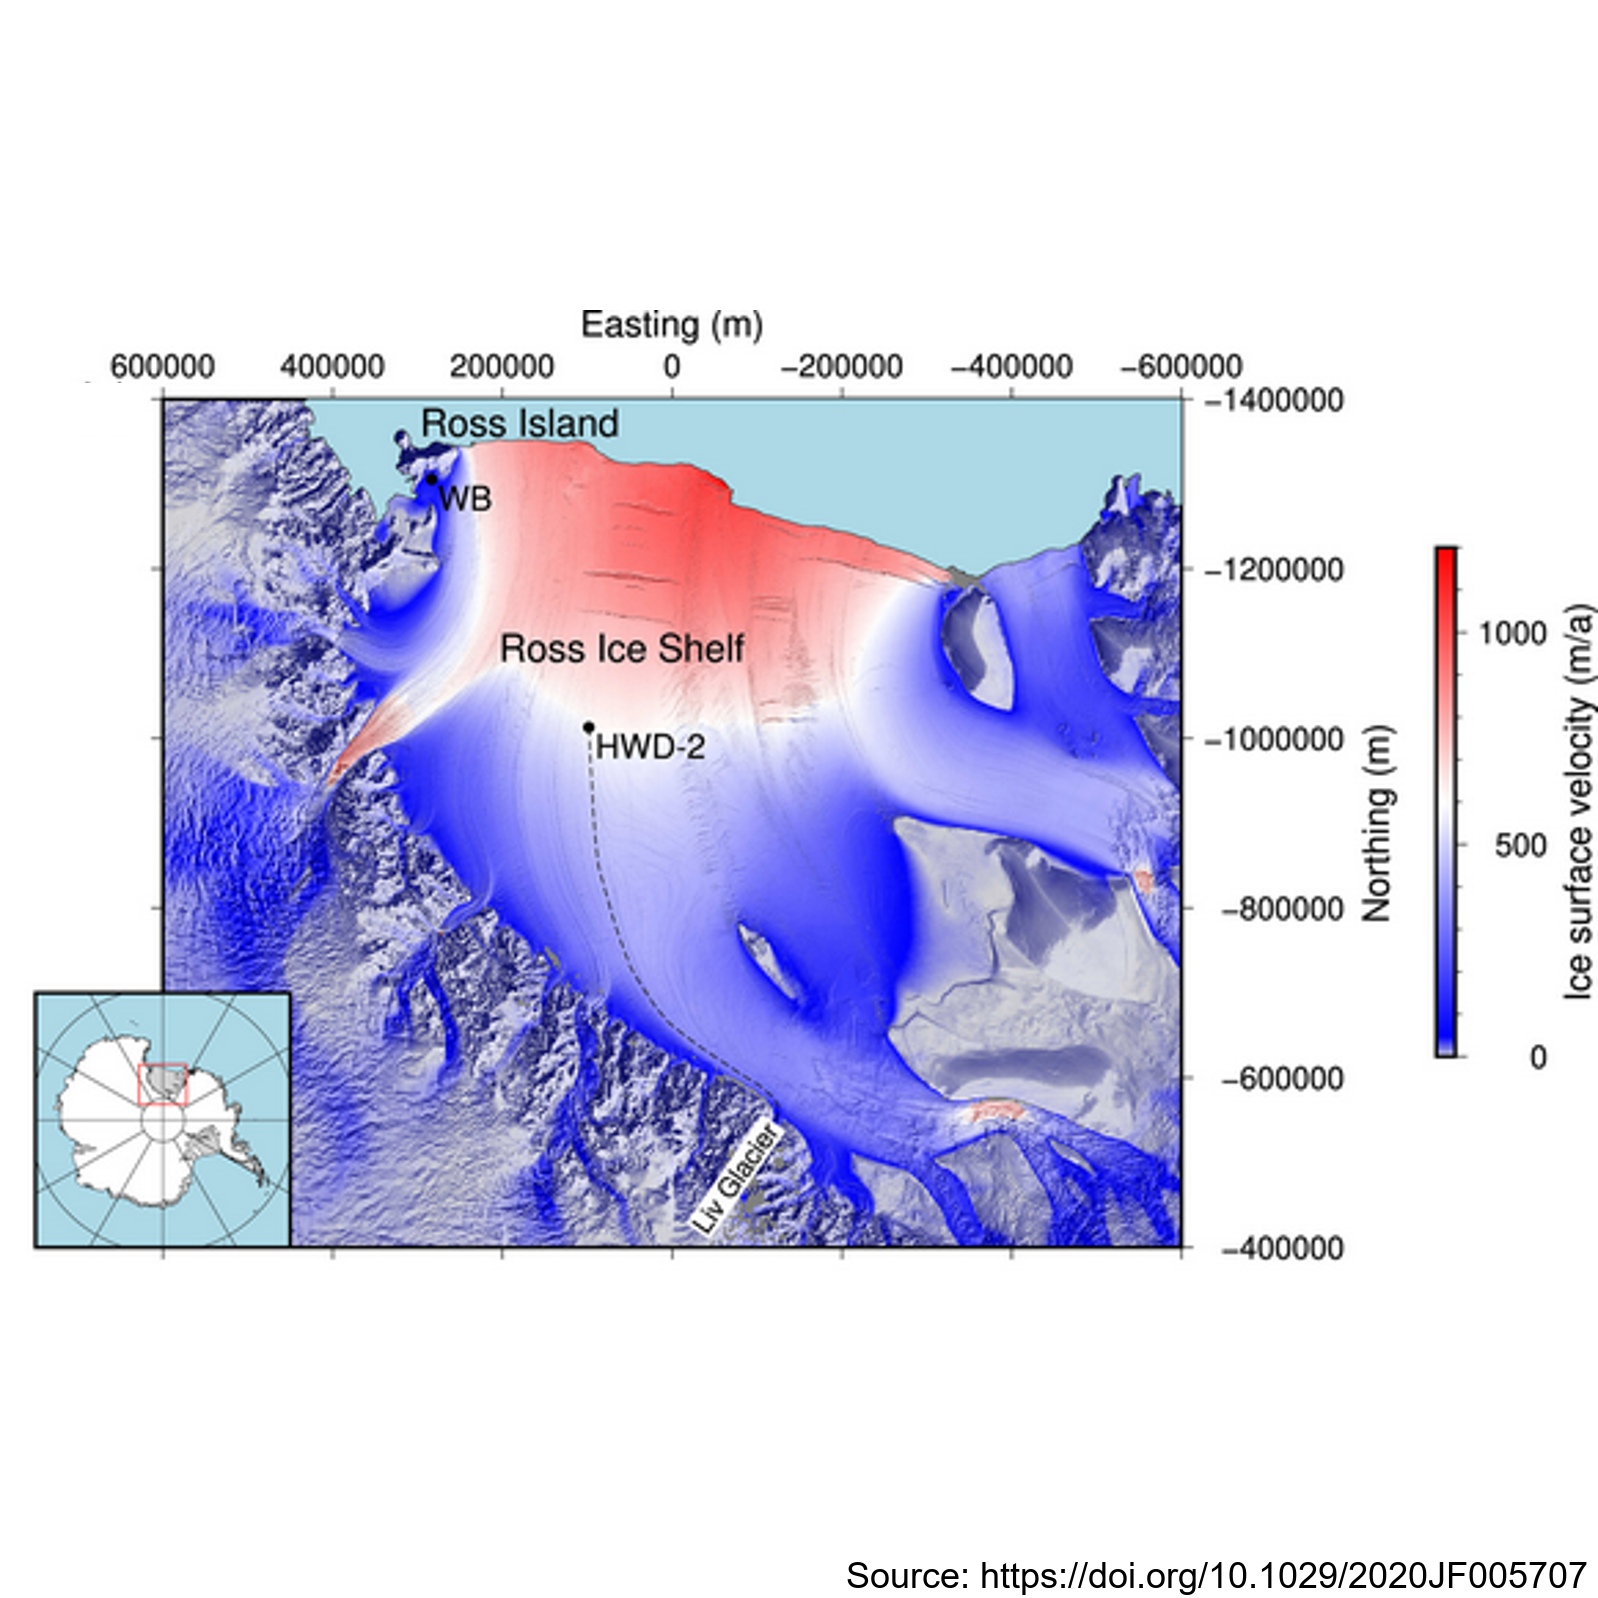
This metadata record presents observations of ice shelf anisotropy derived from borehole seismic data. Hot-water-drilled boreholes were created at two sites: Windless Bight (WB) near the grounding line on Ross Island and HWD-2 in the central Ross Ice Shelf. The boreholes housed seismometers frozen at various depths within the ice, enabling seismic observations of shear wave splitting (SWS) using active seismic sources. At Windless Blight, borehole seismometers were installed at depths of 40 and 190 meters within the ∼220 m thick ice shelf during the 2016/2017 Antarctic field season. Seismic shots were recorded with a 2,000 Hz sampling rate and a 2 s record length, triggered by striking plates. The site was revisited in December 2017 to validate sensor survivability and reproduce survey geometry for SWS analysis using multiazimuth shots. At HWD-2, eight seismometers were deployed at depths ranging from 80 to 325 meters inside the ∼370 m thick ice shelf during the 2017/2018 field season. A total of 747 shots at 53 different shot points were recorded, with clear observations of split shear waves in the data. The study contributes valuable seismic data and methodology for understanding ice shelf anisotropy, enhancing our knowledge of Antarctic ice dynamics and seismic behavior. Further details are provided at: Lutz, F., Eccles, J., Prior, D. J., Craw, L.,Fan, S., Hulbe, C., et al. (2020). Constraining ice shelf anisotropy using shear wave splitting measurements from active‐source borehole seismics.Journal of Geophysical Research: EarthSurface,125, e2020JF005707. https://doi.org/10.1029/2020JF005707 GET DATA: https://auckland.figshare.com/s/9f783802272b825d7ad7
-

In collaboration between Korea Polar Research Institute LDEO and NIWA, an oceanographic mooring was deployed close to the bottom depth in the Drygalski Basin (lat:-75.010487, lon:165.555680) on 6 March 2018 as a part of the ANA08C research cruise, and it was recovered on 5 January 2019. To monitor physical properties (Temperature, Salinity, Current) of deep water in the Drygalski Basin. GET DATA: https://kpdc.kopri.re.kr/search/992862c1-84d0-46aa-97dd-e2dcfb12357e
-
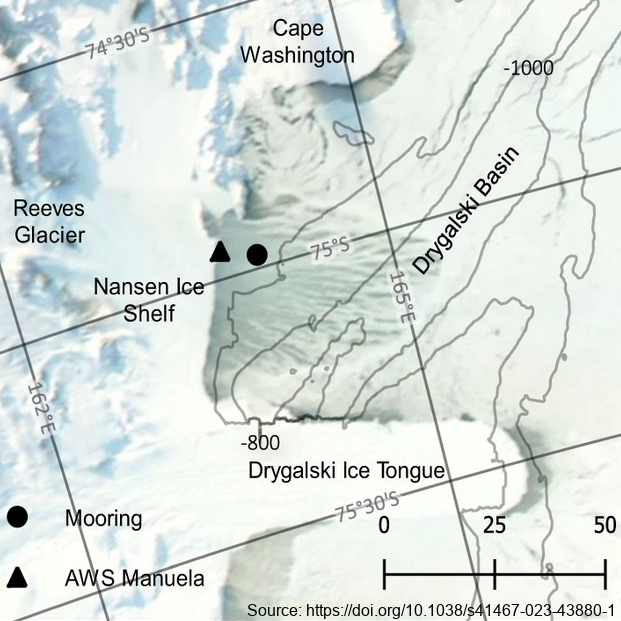
The mooring was deployed from February 2017 through February 2018 at 74.97° S, 163.96° E, approximately 7km east of the Nansen Ice Shelf in a region of TNB. The purpose of this study was to utilize data from a uniquely positioned and densely instrumented mooring to calculate HSSW production rates in TNB from continuous, in-situ observations. Moored instrumentation consisted of 7 SeaBird Electronics conductivity and temperature (SBE37-SM/SMP MicroCAT) sensors at depths of 47, 95, 119, 144, 168, 219, and 360 m and an upward-facing 600 kHz Nortek Acoustic Wave and Current (AWAC) profiler at 37 m depth, collecting both current velocity profiles in the upper ~35 m of the water column as well as Acoustic Surface Tracking (AST) measurements. Temperature and salinity measurements were validated against a shipboard conductivity-temperature-depth (CTD) cast performed upon deployment of the mooring. Temperature and salinity at 47 m and 95 m were additionally validated against a CTD cast performed upon recovery of the mooring. Full details of methods can be found in https://doi.org/10.1038/s41467-023-43880-1 GET DATA: ukm2103@columbia.edu
-
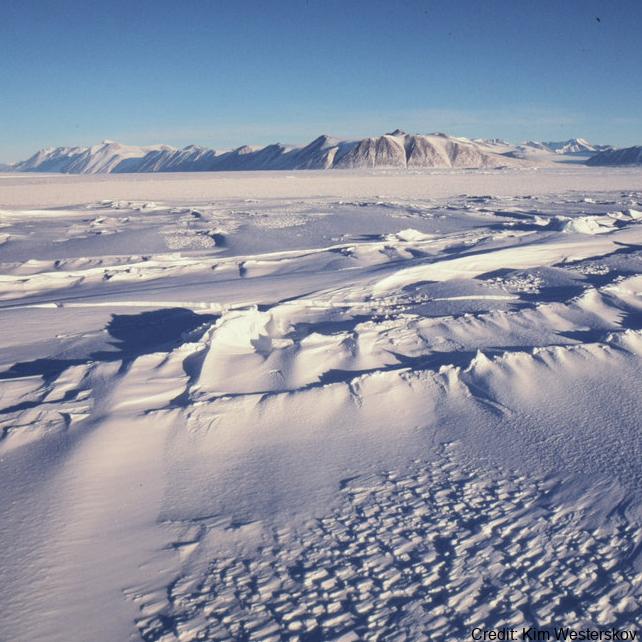
The data are approximately 800 km of airborne electromagnetic survey of coastal sea ice and sub-ice platelet layer (SIPL) thickness distributions in the western Ross Sea, Antarctica, from McMurdo Sound to Cape Adare. Data were collected between 8 and 13 November 2017, within 30 days of the maximum fast ice extent in this region. Approximately 700 km of the transect was over landfast sea ice that had been mechanically attached to the coast for at least 15 days. Most of the ice was first-year sea ice. Unsmoothed in-phase and quadrature components are presented at all locations. Data have been smoothed with an 100 point median filter, and in-phase and quadrature smoothed data are also presented at all locations. Beneath level ice it is possible to identify the thickness of an SIPL and a filter is described (Langhorne et al) to identify level ice. Level ice in-phase, quadrature and SIPL thickness, derived from these, are presented at locations of level ice. For rough ice, the in-phase component is considered the best measure of sea ice thickness. For level ice where there is the possibility of an SIPL, then the quadrature component is considered the best measure of ice thickness, along with SIPL thickness. All data are in meters.
-
Sea ice temperature (°C) measured across 11 depths (57 cm, 78.5 cm, 84.5 cm, 87.5 cm, 96.5 cm, 105.5 cm, 108.5 cm, 114.5 cm, 117.5 cm, 120.5 cm, 129.5 cm) at (LATITUDE: -77.781700, LONGITUDE: 166.315300): RELATED PUBLICATION: https://doi.org/10.1017/jog.2022.108
-

Climate data have been collected at Scott Base continuously since 1957 and more recently from Arrival Heights and is one of the longest continuous climate records in Antarctica. Climate parameters measured include: wind speed and direction, air temperature, relative humidity, barometric pressure, and global, diffuse and direct solar radiation. Climate data are collected on a daily basis from both sites. At Scott Base, this takes two forms: a standard daily observation at 0900 NZDT, and continuous data collection at 10 minute and hourly intervals using a CR10X data logger. The initial record of the 0900 daily observations began on 1 March 1957 with air temperature, air pressure, wind speed and direction, and global solar radiation being measured with standard instrumentation (wind measurements since 1972). This record constitutes the reference record. In January 1997 an electronic weather station (EWS) was added to collect and archive 10 minute and hourly data. The daily manual observations continued so as to provide a continuous reference and daily record. Historically, Arrival Heights only had a wind recorder (since January 1984). A data logger was installed in January 1999 and measured air temperature, relative humidity and global solar radiation using a secondary network sensor, as well as wind speed and direction. A barometric pressure sensor was installed in 2001. A standard 10m mast was installed and all sensors were moved to the new Arrival Heights laboratory in 2007. 10-minute and hourly data are recorded. Data are retrieved and archived from both automatic stations daily, as well as manual observations from Scott Base and available on New Zealand's national climate database. From February 2019, mercury theremometers and barometers were removed from Scott Base and Arrival Heights. Where applicable, these were replaced with electronic instruments. A weighing precipitation gauge was also installed in February 2019 for the measurement of solid precipitation at Scott Base. GET DATA: https://cliflo.niwa.co.nz/
-
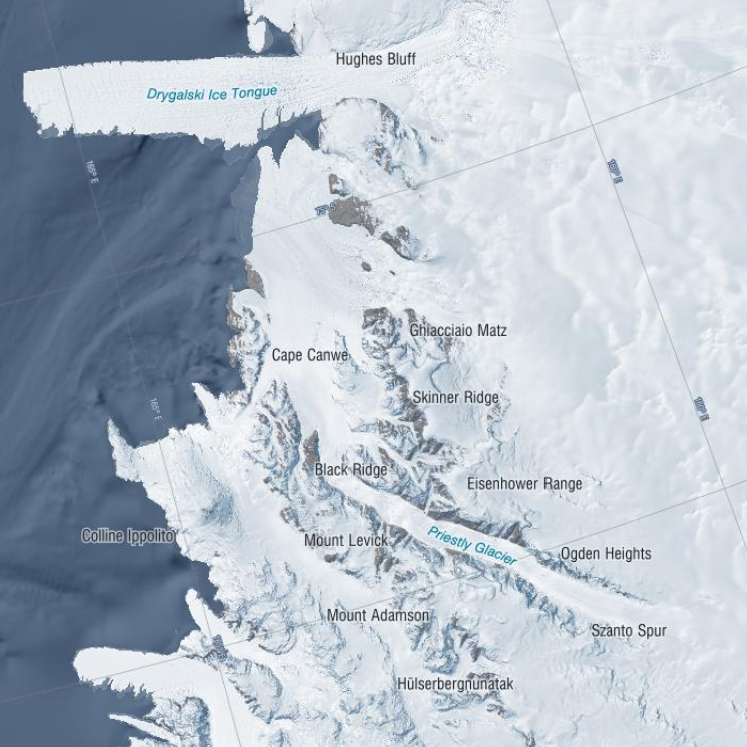
These data were aquired with a Terrestrial Radar Interferometer overlooking the grounding zone of Priestley Glacier, Antarctica. The time series contains differential interferograms with a 12h temporal baseline covering an approximately 8 day period in November 2018. Tidal modulation of ice streams and their adjacent ice shelves is a real-world experiment to understand ice-dynamic processes. We observe the dynamics of Priestley Glacier, Antarctica, using Terrestrial Radar Interferometry (TRI) and GNSS. Ocean tides are predominantly diurnal but horizontal GNSS displacements oscillate also semi-diurnally. The oscillations are strongest in the ice shelf and tidal signatures decay near-linearly in the TRI data over >10 km upstream of the grounding line. Tidal flexing is observed >6 km upstream of the grounding line including cm-scale uplift. Tidal grounding line migration is small and <40 % of the ice thickness. The frequency doubling of horizontal displacements relative to the ocean tides is consistent with variable ice-shelf buttressing demonstrated with a visco-elastic Maxwell model. Taken together, this supports previously hypothesized flexural ice softening in the grounding-zone through tides and offers new observational constraints for the role of ice rheology in ice-shelf buttressing. Time series of line-of-sight flowfields averaged over approximately three hours. Data were taken with a Terrestrial Radar Interferometer in November 2018 at the grounding zone of Priestley Glacier, Antarctica – The Zip Archive contains 288 Geotiff in South polar stereographic projection – Each raster has 4027 x 4746 entries – The file name details the approximately 3h time inverval of aquisition with Stack_YYYYMMDD_HHMMSS_YYYYMMDD_HHMMSS marking the beginning and end of the time interval, respectively. – The line of sight velocities are given in meters per year Related Publication: Drews, R., Wild, C. T., Marsh, O. J., Rack, W., Ehlers, T. A., Neckel, N., & Helm, V. (2021). Grounding-zone flow variability of Priestley Glacier, Antarctica, in a diurnal tidal regime. Geophysical Research Letters, 48, e2021GL093853. https://doi.org/10.1029/2021GL093853 GET DATA: https://doi.org/10.1594/PANGAEA.935702